U.S Equities suffer their second 10% correction of the year, while global equities continue to free fall. All asset classes were down in October.
Domestic Equity: Early Signs of a Trend Reversal in Place
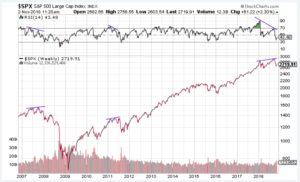
U.S stocks fell 10% from their highs in October, putting a stop to our most recent rally. Perhaps the more concerning development, aside from the price decline, is the disconnect between price action and momentum (RSI). In the chart below you’ll see this same disconnect highlighted in the S&P 500 in 2007, 2011, and now in 2018. In more practical terms, this disconnect is a failed attempt by the stock market to go higher, which can lead to reversal of an upward trend. As you see in 2007 and 2011, the failed attempt was followed by a sharp decline, then a weak rally, before a much greater decline occurs. The fallout for our current iteration of this pattern remains to be seen, but current market movement deserves our close attention.
This market correction will test the mettle of new Federal Reserve Chair, Jerome Powell. The Fed has stated their desire to continue raising rates through next year and beyond. However, markets are becoming less convinced rates will go up given the current weakness in the stock market. Markets have priced in a 70% chance of a rate hike this December, which is down 11% from one month ago. The Fed’s decision to hike or not hike will likely send shockwaves through all asset classes.
Global Equity: Still Looking for Support
Global equities fell with U.S. stocks to the tune of 7.5%. Another ugly month for global equities adds to what has been an poor year overall. Looking across the globe you’ll be hard-pressed to find a country outside of the U.S. that is positive for the year, which brings us to the importance of the next chart. Below, we see a large fund that follows all developed countries, sans the U.S. The observations to be made in this chart are twofold: First, the importance of global equities holding the support provided (blue line) from the 2015 highs; second, how different global stock markets look now versus the U.S. when compared to the pull back in January of this year. If the U.S. is going to rally from this drop, it will need help from the rest of the globe.
Real Estate: Stagnation Tied to Interest Rates
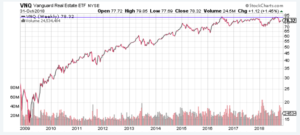
Real estate performed well, relative to stocks, in October but still ended up losing 1.5% overall. We’ve previously mentioned the price resistance that real estate has struggled with over the last few years. Below you’ll see that resistance in chart form, highlighted by the blue line. The flip side of the price resistance has been the resiliency shown in this sector. Despite multiple denials at this resistance level, real estate is holding up well. The primary driver of this resiliency is interest rates. Due to its high yields, if interest rates stop increasing, real estate will be in high demand.
Commodities: The Dollar’s Strength Still Too Much to Overcome
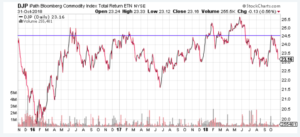
Commodities gave back almost everything back in October, after a strong September, losing 4% over the month. Commodities is another sector hampered by price resistance. Since mid-2016, which is the same time the Fed started raising interest rates from zero, commodities have struggled to hold a price over the value represented by the blue line below. Unless price can be sustained above the blue line, this sector will be hard to trust.
Fixed Income: High Yield Showings Signs of Stress
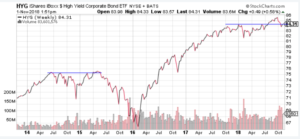
Bonds, both government and corporate, were down in October. High yield bonds, or “junk” bonds, made a huge downward move in October. Junk bonds carry this name because they have higher yields and higher risk of default because the lower quality debt issuer. Junk bonds can help give a glimpse to stress in both the credit and stock markets. Because of the risky nature of junk bonds, investor will flee them when risk in credit and stock markets is elevated. The chart below highlights how the high yield bond market has failed to hold previous high values from earlier this year. If prices stay below the blue line it’s likely we are seeing a trend reversal for risky assets. You can see a similar pattern in 2014-15 prior to the U.S. stock market correction in 2015.
All Terrain Portfolio Update
The All Terrain Portfolio has reduced the majority of risk in the portfolio due to the elevated levels of risk we are seeing in current markets. We will remain diligent in our monitoring of these developing risks.
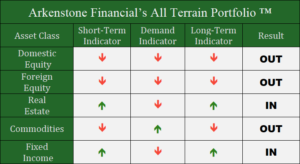
Past performance is not indicative of future results. Other asset classes or investment vehicles may be used in client portfolios and client portfolios may not hold all positions of the model at the same time as the model. This chart and its representations are only for use in correlation to the proprietary timing model by Arkenstone Financial, Registered Investment Advisor. Actual client and All Terrain Portfolio(TM) positions may differ from this representation.
- Rising Rates Create Headwinds - November 8, 2024
- The Fed Finally Cuts Rates - October 10, 2024
- Interest Rates Stabilize, Stocks Bounce - September 6, 2024



Leave a Reply