In a Nutshell: The investment landscape has become increasingly correlated as bonds, stocks, gold, real estate and oil all trade in near-direct correlation with interest rates. Falling rates have boosted risk assets across the globe.
Domestic Equity: Santa Rally?
U.S. stocks continued higher in November, pushing through the 4400 area of interest with ease. The 4600 area now provides the year’s last resistance area. Through that area and a year-end Santa rally would be in the works. Otherwise, the market may need a recharge by going lower first.
As has been the theme for 2023 in our participation chart, we are again in positive territory, but not into “bull market territory” by the red line. Although this is a positive development, it leaves a lot to be desired as the numbers are coming in lower than the prior highs from this year. In other words, we’d like to see more stocks participating in this uptrend.
Our sentiment indicator is back to the red line which indicates a market that may need to cool off. This move from oversold (green) in October to overbought (red) now, is a continuation of the trend that started in early 2022. To speak generally, this ping-pong behavior within the context of a relatively flat market performance over the last two years speaks to a market that lacks direction and trend.
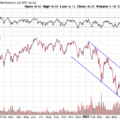
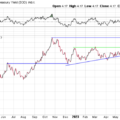
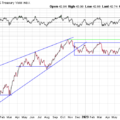
The charts below speaks to this lack of participation and direction and why it has been such a frustrating year from a trend perspective. Below we have charts of medium, large, and small company stocks, respectively. You can see the top and bottom charts (medium and small) haven’t really moved much this year, while large cap stocks buoyed by a few large tech companies have pushed higher. The result is messy, mixed broad stock market behavior.
Short-term interest rates stayed at 5.25-5.50% through the month of November. The Federal Reserve members continued to talk tough about more future hikes and dismissing future cuts. The bond market is finally taking the Fed at its word as rates are projected to be steady for the next nine months. It seems now that any future hikes or cuts will be spurred on by after-the-fact analysis by the Fed of economic and inflation data. Visibility for any market forecasting remains low for the next six-to-nine months.
Global Equity: Attempt #3
Global equities continued their bounce from the October lows, spurred by falling interest rates. From a global perspective you can see below that we are now at the third attempt by global equities to break out of the consolidation zone we’ve highlighted with the blue box. All rallies to this point have failed in 2023. A breakthrough and hold would be meaningful for the entire globe.
While the broader global market continues to tread water, India continues their blistering economic pace. The most recent breakout through the horizontal line was spurred by continued strong economic performance.
Real Estate: Decision Time
Real estate continued higher in November. All risk assets, including real estate, rallied as interest rates continued to plummet. The fundamental headwinds for real estate still prevail, so it’s hard to view this move as any kind of long-term trend shift. However, this sector will get a chance to prove itself one way or another. The chart below shows we are approaching the highs from July. No short-term top has been broken in this sector for almost two years. A break through the July highs would be one piece of the puzzle in building a long-term trend change.
Commodities: Rejected
It appears the big blue line (below) in commodities has prevailed as the sector is now heading lower after multiple rejections. This move is predominantly influenced by the price of oil. Oil has fallen precipitously, in lockstep with interest rates. While this is good news for consumers as gas prices and ultimately inflation is falling, it’s a bit of a concern for future economic growth. Falling interest rates and falling oil prices is a one-two punch of future economic pessimism.
Gold, like every other risk asset, has moved higher since interest rates rolled over in October. Gold briefly traded at an all-time high near $2150/oz recently, and is now back in an up-trend. Interest rates will be the key driver for gold prices as the two trade inversely.
Fixed Income: Rates are Crashing
What a round trip for the 10-year U.S. treasury bond. In only three months, the bellwether for U.S. interest rates rose 18% from 4.25% to 5%, and down 16% back to below 4.25%. As mentioned in all prior investment sections, interest rates falling has been the driver for almost all risk assets to run higher. Everything has become the same trade, unfortunately, which magnifies risk. Bitcoin, bonds, gold, stocks and real estate are all beneficiaries when interest rates drop, given our current economic backdrop.
But is this perspective that interest rates falling is good for the economy correct? Risk assets think so, as interest rates beyond six months are all falling. Looking back on a long-term chart we can see the last three recessions (2000, 2008, 2020) all experienced a 35% or more stock market drop and all followed the same interest rate path, despite each recession having vastly different context and characteristics. In looking at the three-month interest rate chart below, we can see the effect monetary policy makers have on the economic cycle. Each of these cycles we see interest rates (gold) being raised by policy makers. Then there is the pause in interest rates (blue boxes). Eventually, rates break through the trend lower (pink) because policymakers cut interest rates in response to a flailing economy. We are currently in the pause phase, but late in that part of the cycle as rates are trying to break through the pink line.
The late 90s offer some insight, as rates were proactively lowered and the bull market was extended for a few years. With how resolute the Fed is on keeping rates high and defeating inflation, it doesn’t appear we will get any proactive cuts. They will either never come because the economy stays strong, or the cuts will come late and during recession, which has been the case for the last three recessions. According to the charts, it seems like we’ll have our answers fairly soon either way.
All Terrain Portfolio Update
Our model and indicators were flipped back to buy risk assets as this highly volatile and whipsawing market continues to have big moves within short time periods. Most of the risk was added in stocks, while we closed out our commodities position. We now carry about 60% in risk-averse, short-term treasuries less than three years in maturity that are paying interest in the 5-5.45% range. The economic data and outlook continue to be weak, or at the very least murky, as we close out 2023 and move into 2024, so we will follow our indicators as we wait for investment opportunities, but remain agile within our process as new data is presented.
Past performance is not indicative of future results. Other asset classes or investment vehicles may be used in client portfolios and client portfolios may not hold all positions of the model at the same time as the model. This chart and its representations are only for use in correlation to the proprietary timing model by Arkenstone Financial, Registered Investment Advisor. Actual client and All Terrain Portfolio(TM) positions may differ from this representation.
- U.S. Stocks Make New Highs - December 6, 2024
- Rising Rates Create Headwinds - November 8, 2024
- The Fed Finally Cuts Rates - October 10, 2024


Leave a Reply