In a Nutshell: Stocks, bonds and commodities across the globe pulled back in March while interest rates continue to rise.
Domestic Equity: Do Higher Rates Actually Hurt Tech Stocks?
March was tough on stocks and tech stock in particular. The financial media posted a lot of headlines about how rising rates hurt tech stocks, and we looked into it. The green line below is a ratio chart of tech stocks against the broader stock market. The blue line is the 30-year U.S. treasury interest rate. Over the last decade we found four cases where rates were rising while tech stocks under performed. In Q1 2013, Q1 2017, Q1 2019, and Q1 2021, we see deeply negative correlations between tech stocks and rates, while rates are rising. All of these periods ultimately gave way to significant rallies and out performance by tech stocks. In other words, when rates and tech stocks trade this inversely, it has historically been a precursor to big tech stock rallies. With the tech-heavy Nasdaq trailing the SP500 on the year, this potential mean reversion seems to favor technology stocks going forward.
For the last two decades, April has been the best month of the year for U.S. stocks, up over 80% of the time. Each year’s stock market has its own unique characteristics, but according to the seasonality chart below, 2021’s stock market has followed the traditional path very closely. With tech stocks looking to rebound, the stock market could get a boost and keep the bullish April trend alive.
The Federal Reserve continues to remain accommodative with emergency-level treasury bill purchases (quantitative easing). The Fed has stated that any rise in inflation (measure by CPI) will be short lived and interest rates will remain low.
Global Equity: Recharged and Ready to Go
Emerging markets (EM) ended March about 10% down from previous all-time highs. We were looking for a consolidation (pullback) previously and, so far, that’s what looks to be materializing. After breaking a nearly yearlong trend, EMs look like they are completing a consolidation pattern, suggesting another leg up. Despite the positive-looking chart, headwinds are starting to surface in this sector. China, the largest component of emerging markets, is now starting to see slowing growth. This is worth noting as China was the fastest country to bounce back from the pandemic, and is now one of the first countries across the globe showing any kind of recovery fatigue. China is now down 15% from its highs and is becoming a drag on the broader sector.
Real Estate: From Laggard to Leader
Real estate was up about 6% last month and has now put together a very nice quarter to start the year. Real estate is catching a boost from the idea of the U.S. economy reopening as vaccinations increase while COVID cases fall. Below is a ratio chart of real estate versus the stock market. You can see that in 2020, following the start of the COVID pandemic, real estate lagged significantly. The first quarter of 2021 showed real estate beating the stock market – a welcome sight for this beaten down sector.
Commodities: Taking a Much Deserved Rest
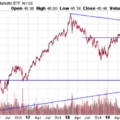
Commodities took a breather in March as the resistance level we called out last month proved too much to overcome. This pullback is a very healthy sign, as bull trends need to cool off and recharge in order to keep going higher. The pullback to support at the $23 range (which was formerly resistance) was textbook in nature. With inflation (CPI) set to move higher in the second quarter of the year and global supply chains backlogged, commodities should be primed for a move up.
Fixed Income: Rising Yields Pause, Likely Go Higher
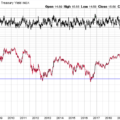
Below is a big picture view of the U.S. Treasury 30-year bond yield. It continues to rise at a rapid pace, putting downward pressure on bond prices. The last two recessions, marked by the blue arrows, have created a lower trend level to this four decade long downward trend. With long bond rates running into this trend channel at the 2.3% mark, a pause was imminent. If our last recession is any gauge, we might see rates eventually get to the top level near the 3% mark. From there we’d expect the trend to resume down, which could provide a good opportunity for investors to buy bonds.
All Terrain Portfolio Update
The All Terrain Portfolio continues to rotate risk into the strongest performing assets within broader sectors. We continue to scale into our positions methodically over time in order to better absorb the current highly volatile investment environment. We will continue to follow our methodology and indicators to find buying opportunities and manage risk.
Chart as of 3/31/21
Past performance is not indicative of future results. Other asset classes or investment vehicles may be used in client portfolios and client portfolios may not hold all positions of the model at the same time as the model. This chart and its representations are only for use in correlation to the proprietary timing model by Arkenstone Financial, Registered Investment Advisor. Actual client and All Terrain Portfolio(TM) positions may differ from this representation.
- U.S. Stocks Make New Highs - December 6, 2024
- Rising Rates Create Headwinds - November 8, 2024
- The Fed Finally Cuts Rates - October 10, 2024


Leave a Reply