In a Nutshell: Interest rates rise at a historic rate, creating stress in both the debt and equity markets. Commodities continue to be an unlikely refuge for investors.
Domestic Equity: Tech Finally Passes the Torch
Stocks in the U.S. ended last month up slightly, but limped into the end of February. The majority of the damage was done in the technology sector, represented below by the tech-heavy Nasdaq composite. Tech had led stocks from the depths of last year’s crash as low interest rates, deflation, and forced technology adoption were massive tailwinds for the sector. With the prospects of the economy reopening and a chance of life returning to normal, tech stocks look like they are on borrowed time. Below you can see a big reversal in process on the Nasdaq. Given technology was already running out of bounds against its decade-long channel, as indicated by the horizontal lines below, the potential mean reversion back to the middle of the channel shows there could be more to this move.
Where are investors hiding out if they are selling their tech darlings like Apple and Microsoft? They are turning to all things economic reopening. The leader of the reopening (or reflation) trade has been energy. Since the November election, oil and gas stocks have been sprinting higher. The chart below showing the relationship between technology and energy stocks highlights the under-performance of technology against energy companies. This is a recent shift in market positioning as technology had led stocks higher for years prior.
The Federal Reserve continues to remain accommodative with emergency-level treasury bill purchases (quantitative easing). Lots of creative ideas on keeping rising interest rates under control have been floated by various Fed members, but chairman Jay Powell declined to publicly endorse any of these ideas, much to the chagrin of the stock market.
Global Equity: Taking a Breather
Emerging markets (EM) ended February roughly flat, despite a big move up and down. We mentioned last month that this sector was getting a little too hot, and could be a candidate for a pullback. The pullback looks like it started mid-month in February and is spilling into March. The chart below looks at the channel EM adhered to since the March 2020 bottom. That channel has now been broken, and there could be more downside. For now this appears to be a garden-variety correction, so we’ll be looking for signs that a new uptrend has started.
Real Estate: Slow and Steady
Real Estate was up slightly last month, but continues to lag stocks on a relative basis. Real estate has been a beneficiary of the encouraging signs of our national health situation. Hopes of reopening the economy have given real estate a boost, but much remains to be seen as to how quickly real estate sectors like office space, apartments, travel and leisure will return to pre-pandemic usage, if ever. We will remain underweight in this sector.
Commodities: Is This Decade Different?
Commodities had another great month in February, tacking on an additional 5% of gains. Inflationary pressures continue to be a tailwind to commodities, as our price targets continue to be met. On the chart below you’ll see more resistance at $25: Break through that level and the sector should run higher.
Putting this recent commodities move in perspective shows some massive implications. Below is the relationship of U.S. stocks to commodities. You can see by the uptrend in the 2010s that stocks outperformed against commodities consistently. That trend is at least temporarily broken with commodities now outperforming stocks in the short term. It’s been a while since we’ve seen this relationship, but as you can see from the chart below the 2000s could be our guide as to what to expect.
Fixed Income: Rising Yields Have Investors Trapped
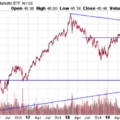
Interest rates have raced higher, up nearly 50% in the first two months of the year. Nominally, the bellwether rate of the U.S. 10-year treasury note is only up 0.5% in 2021. However, the pace at which interest rates are increasing is at breakneck speeds, all while starting from their lowest point ever. Bond yields and bond prices move inversely in a convex relationship, not linearly. A simpler way of saying that is when bond yields start from so low and move up quickly, it puts enormous downward pressure on bond prices. Traditional 60/40 (stock/bonds) investors felt this pressure over the last few weeks as both stocks and bonds sold off together, with bonds offering no protection as stocks fell. This is a rare occurrence to be sure, as we are accustomed to seeing bonds provide portfolio protection when stocks sell off over the last half a century. However, interest rates have fallen for the last 40 years from a starting point of 15% in 1982 to a low of 0.5% in 2020. If rates are going to rise from here, investors shouldn’t expect bonds to provide the protection they once provided to traditional portfolios. As you can see below, the 10-year yield is at a critical level, and being above or below that line will have big implications across many asset classes.

All Terrain Portfolio Update
The All Terrain Portfolio has reallocated risk out of lagging positions. We continue to scale into our positions methodically over time in order to better absorb the current highly volatile investment environment. We will continue to follow our methodology and indicators to find buying opportunities and manage risk.
Past performance is not indicative of future results. Other asset classes or investment vehicles may be used in client portfolios and client portfolios may not hold all positions of the model at the same time as the model. This chart and its representations are only for use in correlation to the proprietary timing model by Arkenstone Financial, Registered Investment Advisor. Actual client and All Terrain Portfolio(TM) positions may differ from this representation.
- U.S. Stocks Make New Highs - December 6, 2024
- Rising Rates Create Headwinds - November 8, 2024
- The Fed Finally Cuts Rates - October 10, 2024


Leave a Reply