In a Nutshell: The bottom fell out of interest rates in July, and global stocks and commodities sold off in kind, creating an enormous amount of volatility across all asset classes.
Domestic Equity: Lightning Quick Correction
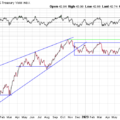
The U.S. stock market got off to a hot start in July only to see a near 10% pullback from all-time highs. The pullback in the Nasdaq (technology) was even more severe, falling more than 15% in just a few weeks. While this correction happened fast, we are trading back down in areas where we’d expect to see some support (blue boxes). At this point in time, we don’t have indicators suggesting to take risk down, making this a yellow flag moment versus a red flag moment. Some of that is the context that while the economy may cool a bit in the third quarter, it still looks quite positive. Some recent labor market data stoked recession fears, but the broader economic data doesn’t support that idea at this time. We will closely monitor the response from stocks going forward.
We see a positive look on our participation model as the blue line, which is often visited in corrections during a bull market, has yet to be hit. We view this as a positive for now.
Similarly, our sentiment model shows a cooling down to the blue line, which indicates we are in a normal (albeit volatile) correction period for stocks.
Short-term interest rate policy remained at 5.25-5.5% as the Fed kept rates unchanged in July. The next meeting is not until mid-September. This is part of what shook markets, as the weak jobs report occurred just days after the Fed said they’d keep rates steady and that the economy was on track. What a difference in sentiment price can make. Stocks sold off quickly after the Fed meeting and now market participants are expecting five rate cuts (1.25%) by year end with an expectation of two cuts (0.5%) in September. Just a month ago, market participants expected just one (0.25%) rate cut in 2024.
Global Equity: Still Ok
The global equity chart remains strong despite the recent stock sell off. The longer-term trend is still intact and we see the big blue box as a likely absorption area that could act as a springboard higher for stocks. The European economic projections still look strong for the second half of 2024, and stronger than the U.S.
India continues to lead the globe higher and remains one of the strongest economies in 2024. India is still holding its uptrend and has only experienced a mild correction of 3% so far. The fundamental story of strong economic growth is still alive for India, but we’ll need to see price hold up in its current area to maintain our bullish tilt on India.
Real Estate: Relative Strength
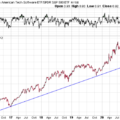
An incredible move by real estate sent the sector up about 12% in the month of July. Not only was that a huge move, it was in the face of the incredible weakness for most risk assets. Real estate is the only risk asset that was up this past month. The chart below tells the story as this sector had enormous energy building under the blue trend line. Falling interest rates pushed the sector higher and, once through the blue line, price moved quickly to the upside. Interest rates will be the key driver going forward, and likely the determining factor to whether or not real estate can maintain this momentum.
Commodities: Crushed
We mentioned previously that this sector was starting to build up some significant potential energy, with months of trading in a pretty tight area. We finally got that move and it was to the downside. Commodities fell nearly 10% move lower by the time July closed out.
Gold had the breakout move that we were anticipating in July. A 5% move higher is nothing to complain about over the course of a month, but we would have expected a little more expansion than we got. The move was hard capped at the mid-July highs, and didn’t get much of a push with interest rates falling to year-to-date lows. Gold still looks good, but will be worth monitoring.
Fixed Income: The Rates Collapse
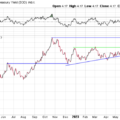
July saw a complete deterioration of interest rates in the bond market. The 10-year U.S. Treasury interest rate fell a staggering 17% in just one month. We had posited that if rates could cool, but remain in the green box, stocks would be happy. Well, rates blew through the box to the downside, and stocks chased rates lower. That’s a huge move based on one bad jobs report. Especially, when Q2 GDP just came in at 2.8% (annualized) and the Atlanta Fed has Q3 projected at 2.9% currently.
Below, we can see the chart of the two-year U.S. treasury interest rate compared to the three-month rate, which is the rate the Fed has control over. The two-year rate is a bit of a crystal ball for interest rates, and it closely mirrors where the Fed should take short-term rates. The bond market thinks the three-month rate is 1.22% higher than it should be, which is where we get our 1.25% in cuts in the Fed commentary from our U.S. Equity section above. This is a bit of a recessionary type pricing response in the bond market, but it seems a little early. Given the fact that GDP still looks good (but is perhaps slowing some) for the rest of the year and that we have a presidential election just months away. The current data is just too strong to price past an event like a presidential election, which will likely have a wide array of potential outcomes for economic policy based on the winner. Said another way, we see caution signs for the economy flashing at this time, not warning signs.
All Terrain Portfolio Update
Our model and indicators had us selling our commodity exposure as we entered August. Aside from commodities, we are fully allocated across our other core sectors while still carrying about 20% in risk-averse, short-term treasuries less than three years in maturity that are paying interest in the 5-5.45% range. The economic data and outlook still appear neutral to slightly positive as we move further into 2024. Inflation, and by extension interest rates, will be the key driver for asset returns this year. We will follow our indicators as we wait for investment opportunities, but remain agile within our process as new data is presented.
Chart as of 7/31/24
Past performance is not indicative of future results. Other asset classes or investment vehicles may be used in client portfolios and client portfolios may not hold all positions of the model at the same time as the model. This chart and its representations are only for use in correlation to the proprietary timing model by Arkenstone Financial, Registered Investment Advisor. Actual client and All Terrain Portfolio(TM) positions may differ from this representation.
- U.S. Stocks Make New Highs - December 6, 2024
- Rising Rates Create Headwinds - November 8, 2024
- The Fed Finally Cuts Rates - October 10, 2024


Leave a Reply