In a Nutshell: Risk assets across the globe finished the year white hot, capping an impressive two-month run to finish 2023. Interest rates and commodities continue to run lower. Economic outlooks remain murky, with the global economy set to cool some to start 2024.
Domestic Equity: Air Is Getting Thin, Again
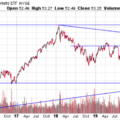
With an incredible finish to 2023 over the past two months, the S&P 500 plowed through our 4600 area of interest, leaving some air pockets behind. Much like we saw with a similar set up this past summer that eventually led to a 12% decline, we are once again seeing a market that is a bit too far out over its skis. This market looks exhausted from a big move that was light on volume, with red hot sentiment. After a very strong Q3 2023 GDP number, the economy will almost certainly slow into 2024, but how much will be the big question. Earnings growth estimates for 2024 for the S&P 500 are also quite light. Toss in a seasonal tendency to provide buying opportunities for the first quarter of the year, and we expect some of the blue boxes below to be tested early in 2024.
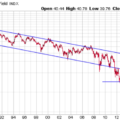
For the first time in two years, the oversold side of our participation chart was finally hit, which prompted a quick retreat. This is a very positive development as we are now seeing a more broad-based participation in the stock market, as opposed to a select few large technology companies propping the market up.
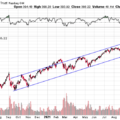
Our sentiment indicator was scorching into the year-end and took out the highs we saw this past July. With some sort of cooling needed at this point, a nice pullback that avoids the lower green line would be ideal.
Short-term interest rates stayed at 5.25-5.50% through the month of December. In a remarkable twist of events, the Federal Reserve Chair Powell stated the Fed expected to cut rates in 2024. This seemingly unprompted comment, considering inflation is still above the Fed’s target, sent future rates lower. As a result, the bond market is expecting six rate cuts in 2024, with anticipation for year-end short-term interest rates to be below 4%.
Global Equity: Out of the Box, Again
Global equities followed U.S. markets higher to close the year out, albeit with a similarly murky economic path forward in the first half of 2024. Although it does appear that the global economy looks positive by the back half of 2024, the main driver of global growth, China, continues to struggle. Given the murky and mild first half predictions for the global economy and the blistering pace higher from global markets over the past two months, patience will be key with this sector.
While the broader global market continues to tread water, India continues their blistering economic pace. The most recent breakout through the horizontal line was spurred by continued strong economic performance.
Real Estate: Showing Signs of Life
Real estate continued higher in December on the heels of falling interest rates. For the first time in about two years, the real estate sector has traded through a prior immediate-term peak. This type of price action does not confirm that we’ve changed from a down trend to an up trend, but it is a good start. Patience will likely be key in this sector as real estate, like all risk assets, had an incredible two-month run to close out the year, but it is due to cool its jets. Risk assets and interest rates look exhausted, so we will need either a drop in price or a consolidation over time before we should look for the next move higher.
Commodities: Down, But Not Out
Commodities remain stuck, but on the wrong side of an important level (blue line below). Commodities as a whole were one of the few broad indices that did not rise over the past few months as one of the biggest pieces of the commodities complex, oil, fell along with interest rates. This index has traded between the June 2023 lows and resistance area (blue line) for the past year. While the global economy appears to be at least slowing some into 2024, we’d be anticipating a move lower, eventually for this sector.
Gold had a strong finish to 2023 and maintains a bullish long-term backdrop. Based on the chart below, you can see gold is working on an eight year uptrend with the majority of the last four years consolidating near all-time highs. If the yellow metal can break through and hold the horizontal blue line below, gold could have a long runway.
Fixed Income: Rates Are Crashing, Still
What a trip lower for the 10-year U.S. treasury bond. The bellwether for U.S. interest rates fell 25%, touching 3.75% down from 5% just two months ago. Falling interest rates continue to be a huge driver for almost all risk assets to run higher. Risk assets have become highly correlated, unfortunately, which magnifies risk. Bitcoin, bonds, gold, stocks and real estate are all beneficiaries when interest rates drop, given our current economic backdrop.
Taking a look at the Federal reserve’s preferred yield curve measure, we see a highly inverted curve. The chart below is showing bond yields are much lower two years out than just three months out. This can be explained by the bond market expecting interest rate cuts by the Fed. However, over the last year, we haven’t gotten those expected cuts. Traditionally, this interest rate scenario has preceded recessions. However, with inflation still above targets, that does muddy the signal a bit on why interest rates are expected to go lower.
We are now approaching nearly four years of our current bond bear market, the longest stretch in the last century. So by historial measures we are in uncharted territory. It appears, at the very least, 2024 will be an interesting year for the bond market.
All Terrain Portfolio Update
Our model and indicators had us buying more risk assets as this highly volatile and whipsawing market continues to have big moves within short time periods. Most of the risk was added in stocks. We now carry about 40% in risk-averse, short-term treasuries less than three years in maturity that are paying interest in the 5-5.45% range. The economic data and outlook continue to be weak, or at the very least murky, as we close out 2023 and move into 2024, so we will follow our indicators as we wait for investment opportunities, but remain agile within our process as new data is presented.
Past performance is not indicative of future results. Other asset classes or investment vehicles may be used in client portfolios and client portfolios may not hold all positions of the model at the same time as the model. This chart and its representations are only for use in correlation to the proprietary timing model by Arkenstone Financial, Registered Investment Advisor. Actual client and All Terrain Portfolio(TM) positions may differ from this representation.
- U.S. Stocks Make New Highs - December 6, 2024
- Rising Rates Create Headwinds - November 8, 2024
- The Fed Finally Cuts Rates - October 10, 2024


Leave a Reply