In a Nutshell: Risk assets sold off across the globe in August as the pressure of rising interest rates finally caught up with stocks. Inflation in the U.S. and abroad is looking perky again, with oil making new one-year highs.
Domestic Equity: Letting Some Air Out
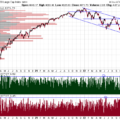
The U.S. stock market closed the month lower in August for the first time since March of this year, despite strong initial projections for the third quarter U.S. GDP. We maintain that the low volume summer move higher from June to July has left some holes that need to be patched in the stock market structure. Trading sideways for a while, like we saw in August, or a trip lower to the blue box would be two ways to reset the market structure. From a seasonal perspective, we are entering the weakest and most volatile month of the year for stock in September – so a move down to the blue box may still be in the cards.
Our participation chart once again produced a weak result as it went and remained negative in August. This is a disappointing follow up to one of the best prints we’ve seen for participation in over a year. We are still absent a broad-based stock market recovery.
Our sentiment indicator is back to neutral (blue line), but from overbought (red line). Every trip over the last two years to the red line has sent us to the green line (oversold), which is typical of bear or sideways markets. As we mentioned last month, how the market responds from here will be quite telling, as we could be in the midst of a phase shift to a bull market. Bull market behavior tends to oscillate between the red and blue lines with price trending higher.
Short term interest rates stayed at 5.25-5.50% through the month of August. The Federal Reserve, along with other global central bankers, had their annual meeting in Jackson Hole, WY at the end of August. The much-anticipated speech from Fed chair, Jerome Powell, was clear: The Fed will maintain higher interest rates for longer to make sure inflation does not reaccelerate again. The interest rate market responded in kind by pricing in a chance of another interest rate hike for 2023. Additionally, the bond market is expecting interest rates to be at 4.5% by year end 2024. That forward pricing indicates the bond market expects the economy to slow over the next 12-18 months, but that it expects the Fed to keep rates relatively high. This is a departure in thinking for the bond market – for the better part of the last two decades, the Fed has taken short term interest rates to zero as a policy response to a weakening economy.
Global Equity: Couldn’t Hold Up
We wanted to see global equities hold up at the top of the blue box, but they failed to do so in August. Price falling back into the blue box is not a great sign from the global economy, especially with Europe and China showing significant economic weakness. China has already cut interest rates to try to stimulate their economy. Europe may not have that luxury as inflation remains sticky.
Parts of Asia continue to be a refuge for investors and Japan and India continue to pace the global economy. India, pictured below, has already recovered nicely from its August stumble. With the global economy so murky looking, we continue to look for country-specific exposure where local economies have shown and project future strength.
Real Estate: Still Weak
Broader selling pressure across risk assets was too much for real estate to handle as the sector sold off through support. We posited that a headfake seemed likely last month as price briefly popped above the blue support line. Rising interest rates, sticky home prices, vacant commercial buildings and new regulatory pressure on short-term rentals continue to pile up as headwinds for this investment sector. It seems a lot of resolution will be required in this sector to get tailwinds fully behind it again.
Commodities: Commodities Lead Inflation Higher
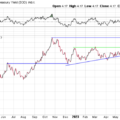
The commodities sector took a breather in August along with all other risk assets. The big move in commodities failed at the very important blue line below. The encouraging price action over August indicated that commodities have reloaded and are taking another shot at breaking through the big resistance in the $32.50 area. The bad news is that inflation did creep up last month for the first time in over a year, something the price move in commodities previously foretold. The question now is how much higher will inflation go from here.
The big driver of our recent inflationary impulse is oil, which ripped 8% higher in August. This move came off of key support and resulted in a one year high water mark for the price of oil. Objectively, this is one of the most bullish looking charts investors will see. Good news for commodity investors, bad news for consumers as gas pump prices will continue to soar.
Fixed Income: Higher, for Longer
Interest rates for the 10-year U.S. treasury bond are now trading at the highest they have been since 2008. After a long consolidation in the blue box, interest rates broke out, and set new recent highs.
Since bond prices move inversely to interest rates, the result of this move in interest rates has been historically bad for bond price return. In fact, we are in the midst of the worst three year stretch for bond price over the last century, and it’s not even close to the next worse three year period.
The picture for the 30-year U.S. treasury bond interest rates looks similar as new 10-year highs were just set when the 2022 highs were taken out last month.
Longer-term interest rates tend to be pushed around by future growth and inflation expectations. We are now (at least short term) seeing inflation pop back up again with short-term economic output looking strong for the third quarter of 2023 – thus interest rates push higher. The challenge with sustaining economic growth with rising interest rates is that it eventually either pushes inflation higher or chokes out economic growth. Our forecasting suggests growth will be hard to maintain as we enter 2024.
All Terrain Portfolio Update
Our model and indicators kept our risk levels flat into September. Despite staying flat, our risk was reallocated from real estate to commodities. However, 50% of our model remains in risk-averse, short-term treasuries less than three years in maturity that are paying interest in the 5-5.35% range. Economic data and outlook continues to be weak as we close out 2023 and into 2024, so we will follow our indicators as we wait for investment opportunities, but remain agile and follow our process as new data is presented.
Past performance is not indicative of future results. Other asset classes or investment vehicles may be used in client portfolios and client portfolios may not hold all positions of the model at the same time as the model. This chart and its representations are only for use in correlation to the proprietary timing model by Arkenstone Financial, Registered Investment Advisor. Actual client and All Terrain Portfolio(TM) positions may differ from this representation.
- U.S. Stocks Make New Highs - December 6, 2024
- Rising Rates Create Headwinds - November 8, 2024
- The Fed Finally Cuts Rates - October 10, 2024


Leave a Reply