In a Nutshell: Risk assets and interest rates were roughly flat for the month of May. Nearly all markets continue to hold in a sideways pattern as new economic data is digested.
Domestic Equity: Breaking Out?
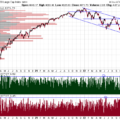
The U.S. stock market was flat in May despite impressive performances from large technology companies. As you can see below, as the calendar turned over into June a breakout of our 3800-4200 box that we’ve been highlighting commenced. However, this breakout is lacking broad-based stock participation, so it’s difficult to say this is a green light for risk assets.
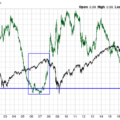
It has been noted that the vast majority of the stock market return has been accounted for by just a handful of stocks that are so large they can push the market around. In fact, about 97% of the year-to-date return for the S&P500 can be attributed to about 10 stocks. The remaining 490 companies have really struggled this year, as you can see below in our chart. When you provide all 500 companies with the same weighting, or effect, on the index ($SPXEW) the index return is actually negative for the year. Compare that to the index performance of +9% on the year and you can see how the behemoths of Apple, Microsoft and Nvidia have helped prop up the market.

Our participation chart shows we are still in negative territory and have nowhere near the participation we had in February, despite the index trading higher now than it was then.

Our sentiment indicator is again neutral, despite the recent breakout in stocks. Ideally, we’d want to see positive participation and sentiment with a new high mark on the year, but this is the market we have to play right now.

The Federal Reserve raised interest rates 0.25% again in the early days of May, taking rates to the 5.00-5.25% range. For the first time in about 18 months, the bond market does not expect more interest rate increases for this cycle. As of right now, the interest rate market expects the Fed to pause raising rates, and to not resume. There is a slight bias to a rate cut by year end. The Fed’s next chance to raise rates will be mid-June, so we won’t have to wait long to see if the bond market’s prediction is correct.
Global Equity: Still Boxed In
Global equities were down slightly over the month of May and continue inside their trading range over the last six months. The resiliency of global equities is quite impressive as pockets of Europe are still battling with rising inflation. The Eurozone just recently posted back to back quarters of negative GDP growth, which means, technically, they are in a mild recession. Additionally, China’s economy continues to decelerate.

However, one of the strongest stock markets in the world can be found abroad. Japan’s stock market has had one of the best starts to the year across the globe, up nearly 15% to date. Despite being dead money for nearly two decades, Japan’s fundamentals are starting to line up positively for a potential medium to long-term investment. For now, we’ll continue to focus on country-specific opportunities as the broader global equities space is a bit murky.

Real Estate: Going Nowhere
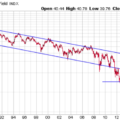
Despite risk assets catching a bid to start the year, real estate is still in the red for 2023. As we’ve mentioned previously, real estate has a few macro headwinds that will make short term positive returns very difficult. Technically, the sector is stuck in a sideways range as highlighted below with the blue box. Additionally, the sector is trading well below its February 2023 highs, while most risk assets are trading near those prior highs. Relatively speaking, this is one of the weakest risk assets to own right now.

Commodities: Continuing Lower
The commodities sector continued lower in May. Oil continues to fall despite yet another OPEC production cut, in an attempt to buoy prices in an environment where demand is falling. We are seeing other production-related commodities like copper and lumber falling as well.
Gold took a crack at all-time highs to start the month of May, but ultimately fell just shy as interest rates oscillated back higher again. The chart and macro case for gold is still strong, but we’d like to see some support at the current price level hold before heading higher to confirm the longer-term prospects

Fixed Income: Interest Rates Remain Trapped
The 10-year U.S. treasury interest rate continues to ping pong back and forth within the blue box drawn below. Almost like clockwork, as interest rates reach the bottom of the box, we’ve seen positive or at the very least “less bad” economic data or policy to support the bond market. Near the top of the box we’ve seen economic stress or policy maker commentary that ultimately pushes rates lower. These periods of consolidation can lead to big moves in either direction, so when a move is made through either side of the box, we’ll be ready.

When it comes to which direction interest rates will go when the box is broken, the chart below suggests that, historically, rates will go lower. We again highlight an inverted yield curve chart, this time the two-year minus the three-month curve. This curve is an approximation of the Federal Reserve’s preferred yield curve measure. You’ll see below the last two inversions on this chart (as highlighted by the red portion of the line) have preceded recessions by about nine months.

The eventual result of each of these prior inversions was that yields across the curve went lower, while interest rates at 30 days or less went to zero. Is this time different? We’ll keep a close eye out on this particular chart to find out.
All Terrain Portfolio Update
We continue to hold small positions in defensive stocks, precious metals and global equity. The vast majority of the model remains in risk-averse, short-term treasuries that are paying interest in the 5.1% range. Economic data and outlook continue to be weak for the first half of 2023, so we will remain risk averse and agile until the data improves. We will continue to wait for investment opportunities and, in the meantime, follow our indicators and process to adjust risk as new data is presented.

Past performance is not indicative of future results. Other asset classes or investment vehicles may be used in client portfolios and client portfolios may not hold all positions of the model at the same time as the model. This chart and its representations are only for use in correlation to the proprietary timing model by Arkenstone Financial, Registered Investment Advisor. Actual client and All Terrain Portfolio(TM) positions may differ from this representation.
- U.S. Stocks Make New Highs - December 6, 2024
- Rising Rates Create Headwinds - November 8, 2024
- The Fed Finally Cuts Rates - October 10, 2024


Leave a Reply