In a Nutshell: Stocks and bonds both suffered their worst start to a year in over 30 years, while first quarter U.S. GDP showed economic contraction for the first time since 2020.
Domestic Equity: The Worst April in 52 Years
The stock market sold off nearly 9% in April, making it one of the worst April returns of all time. This is particularly alarming as seasonally April is typically one of the best months of the year. This brutal sell off came on the heels of the failed breakout at 4600 we noted last month. The sell off came with good reason too, as the first quarter U.S. GDP came out during April at -1.4% annualized with expectations around +1.0%.
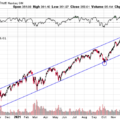
Although the S&P 500 is not a very technically clean chart, the trend is clearly down. A rally to the top of the channel could occur first, but a move to the 4000 point level is of particular interest to us. It’s our view that this area was really the break that started the 2021 rally. How the market responds to filling that gap will be telling, if we get there. The interesting part of this year’s decline is that we haven’t seen the hallmark final flush we often see at the bottom of bear markets. The bottom of the March 2020 lows were highlighted by multiple days where more than 90% of all securities in the index were negative. This capitulatory bearish trading often directly precedes market bottoms. You’ll see we’ve had no 90% (blue line) down days and only a few breach the 80% down volume, so the selling has been pretty orderly by this standard.
There may be good reasons why we are not seeing any bottom forming behavior with stocks at this point. For starters, we have negative GDP in our rearview mirror, but looking forward there may be bigger challenges for GDP and U.S. corporate profits. Year over year profit growth will be challenging to show because of the enormous profit growth and margins shown by U.S. companies last year.
The chart below shows S&P 500 company profits in aggregate. You can see corporate earnings have typically peaked right at the blue trendline over the last 20-plus years. Through the combination of direct government payments to consumers, increased pricing power of corporations through limited supply and increased demand, company profitability blew through the 20-year trend. In fact the second and third quarter earnings growth of last year (starting with the green line in 2021) were the largest in this time series and one of the greatest expansions of all time. This will make it exceptionally difficult for companies to show growth on a yearly basis when compared to the second and third quarter results of last year. U.S. GDP growth will face a similar challenge over the next quarter or two as well.
The Federal Reserve is set to raise short-term interest rates by 0.5% in early May – the largest hike since 2000. The market expectation is now that we will see at least 10 0.25% interest rate increases with a target of 2.25% to 2.75% by year end. This, coming from 0% interest rates, is an incredibly fast pace and will put enormous pressure on economic growth. Additionally, the Fed announced they will be withdrawing liquidity (also called quantitative tightening) from banks in an effort to offset the stimulus that was lent out during the Covid crisis. The Fed is behind the curve on inflation and is effectively communicating that they will be incredibly aggressive in tightening financial conditions to stop inflation and they will do so at the risk of stalling out the economy. The real challenge for the Fed will be executing on their financial tightening plans, if the economy is already decelerating as first quarter GDP is indicating.
Global Equity: The Trend Is Clearly Down
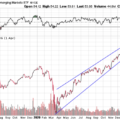
Global equities continue to suffer losses in 2022. While developed markets have fared a bit better than emerging markets, relatively speaking, both have traded in clear downtrends for nearly a year. Russian conflict and Chinese Covid-related lockdowns have continued to put pressure on emerging economies, but there isn’t much to be optimistic about with global equities in general. Broadly speaking, past price action has been bad and future economic growth in 2022 looks poor. This is an equity style to avoid for now.
Real Estate: Rising Rates Are Too Much
Real estate held up fairly well in the midst of the stock market decline through the first quarter of the year, but that strength gave way in April. Like most risk assets, real estate sold off about 8% in April alone. We had been optimistic that real estate could give us a less volatile option to stocks given the low correlation to stocks and more defensive nature. However, cost pressure of rapidly rising interest rates proved to be too much for this sector. For example, if you account for both the increase in mortgage rates and price appreciation, residential real estate is about 50% more expensive than it was one year ago.
More specific to the publicly traded real estate we watch, we’ll want to see the first level of support hold (below) to consider a future position. If that level doesn’t hold, another 10% drawdown would be possible.
Commodities: Losing Strength, Can It Hold On?
Since the beginning of the inflationary and commodities cycle in June of 2020, commodities have stayed on a very consistent path, exhibiting tremendous strength. The more short term cycle we’re watching has been largely accounted for in 2022 with the assistance of the food and energy fallout from the Ukrainian conflict. This trend is much steeper and likely less sustainable. In fact, we’re seeing what could be the beginning of a price breakdown confirmed by falling momentum. The broad basket of commodities we follow is heavily weighted to food and energy, so a further breakdown in price here could indicate slowing inflation is ahead. Having said that, the trend for both inflation and commodities is up until proven otherwise.
Gold had its worst month of the year in April after initially getting off to a great start to the year. Gold tends to do very well during falling real economic growth and we saw just that as the first quarter U.S. GDP was -1.4% annualized. With economic growth looking to stall further in the second quarter of this year, gold should still be a strong play. Sometimes selling pressure from risk assets can sometimes leak into all assets, and that seems to be the case for gold last month. We’ll want to see the support level below the current price hold for the bullish thesis on gold to remain valid.
Fixed Income: Make or Break Time for Interest Rates
Interest rates are increasing at breakneck speeds as the Federal Reserve telegraphs their desire to stop out inflation through future policy decisions. In less than one year the 10-year U.S. treasury yield is up over 135% and is bumping up against the 3.00% barrier. This level has been resistance for the 10-year yield as it failed to spend any meaningful time above it over the last decade.
From an even longer-term view you can see the current level is threatening the four decades long trend channel of falling interest rates. Interestingly, the last time we breached this channel was in 2018 – a period which, aside from high inflation, has a lot of similarities to our current economic backdrop. Both in the fall of 2018 and at present time, the Federal Reserve was hiking rates while the economy was softening, and narratives were emerging that rates would go much higher. Ultimately in 2018, stocks sold off 20%, the Fed stopped hiking after the sell off, and bonds enjoyed an incredible two-year rally as rates plummeted. As the saying goes, history rarely repeats, but it does rhyme – we’ve already seen a 13% decline in stocks with the Fed still intent on hiking.
The big difference between present day and 2018 is the exceptionally high inflation we have which, to reiterate, puts the Federal Reserve in an undesirable place. They have to fight inflation, but how much, if any, collateral damage must be endured? This all points to several important questions we’ll need answered before we can understand the bond and stock market medium to long term paths: How high will rates have to go to stop inflation? Will the Fed continue to raise rates, if stocks continue to fall? Is the economy strong enough to absorb rate hikes in order to slow inflation? We should start to get initial answers to these questions over the next three months as new economic and inflationary data rolls in alongside planned financial tightening by the Federal Reserve.
All Terrain Portfolio Update
Our indicators and models pushed the allocations in the All Terrain Portfolio even more defensive with the largest model position being cash. Our positioning has allowed us to reduce volatility significantly and greatly outperform traditional stock and bond portfolios. We will continue to follow our indicators and process to adjust risk as new data is presented.
Past performance is not indicative of future results. Other asset classes or investment vehicles may be used in client portfolios and client portfolios may not hold all positions of the model at the same time as the model. This chart and its representations are only for use in correlation to the proprietary timing model by Arkenstone Financial, Registered Investment Advisor. Actual client and All Terrain Portfolio(TM) positions may differ from this representation.
- Rising Rates Create Headwinds - November 8, 2024
- The Fed Finally Cuts Rates - October 10, 2024
- Interest Rates Stabilize, Stocks Bounce - September 6, 2024


Leave a Reply