In a Nutshell: Stocks go nowhere while bond and real estate prices perk up at the prospect of interest rates stalling.
Domestic Equity: Stocks Struggling to Find Positive Momentum
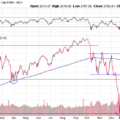
U.S stocks were mostly flat for the month of November. While it was nice to see the bleeding stop, U.S. stocks did nothing to show that the recent uptrend is still on. The blue line in the chart below is the threshold that U.S. equities must breach, and hold, for bullishness in stocks to kick back in. The arrows indicate how investors have respected this price value over the last year. If stocks are below it, it’s hard to be positive about U.S. stocks.
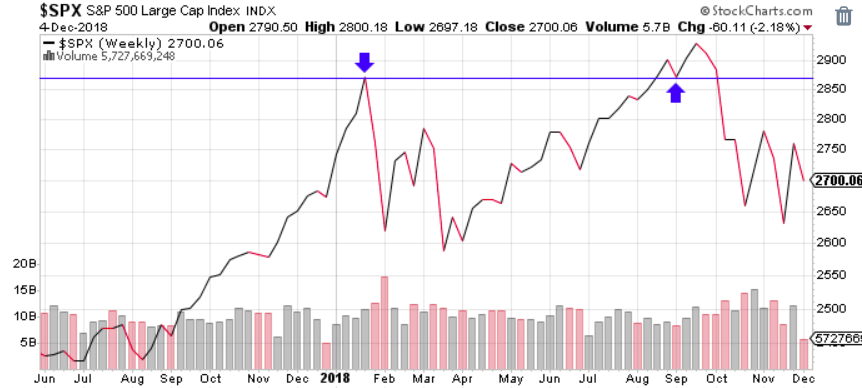
Federal Reserve chairman Jerome Powell spoke publicly about the state of the U.S. economy in November, stating that more interest rate hikes are to come in 2019. Markets were not convinced: Currently, the chances of a rate hike in December are 78%, while the market is pricing in just one hike for 2019.
Global Equity: Major Support Tested Again
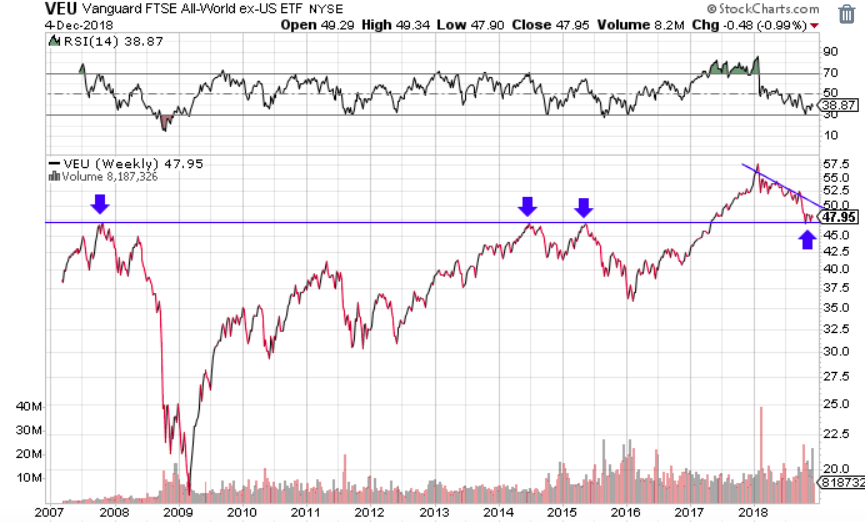
Global markets were down slightly over the month of November. More importantly, global markets didn’t bounce much off of the key support we highlighted last month. In the chart below, we’ve highlighted this support level, and broadened the scope to show just how immensely important this level is. As you can see, this price level (the blue line below) was a barrier in 2008, 2014, and 2015. Once broken in 2017, it became the new support for global equities. This price level has been a key point for global markets for over a decade and must hold if we are to have any hope of global growth resuming.
Real Estate: Trying to Break Out of Two-Year Range
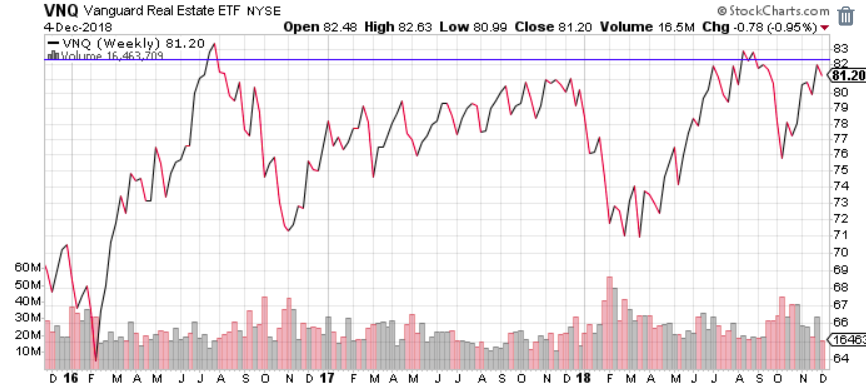
Real estate had a great month in November, climbing nearly 5%. Real estate is making another approach to the key price level we’ve highlighted with the blue line below. If the real estate market remains below the line, real estate is destined to side step growth for a while longer. If it can break out above the blue line and hold, a new uptrend could be in place. With its high yield characteristics, if interest rates fall, real estate could be a big benefactor.
Commodities: Oil Leads to Bottom of Trading Range
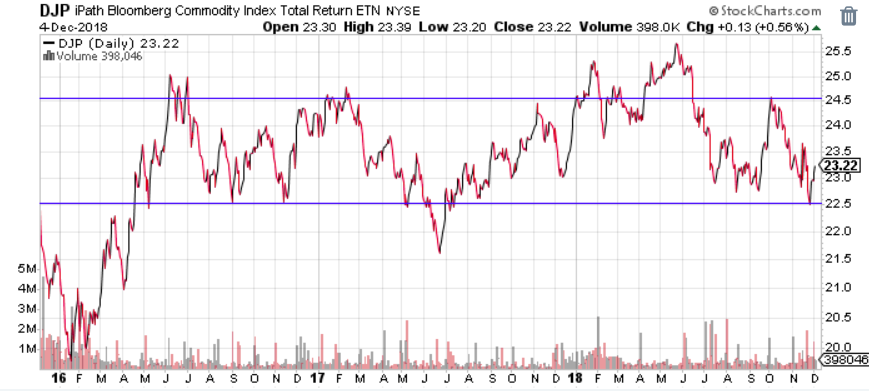
Commodities have been stuck in a trading range that goes back nearly three years, and crashing oil prices have pushed commodities back down to the bottom of this range. As long as this sector stays within its narrow range, it won’t be much help to investors.
Fixed Income: Junk Bonds Get Worse, Treasuries Gaining Momentum
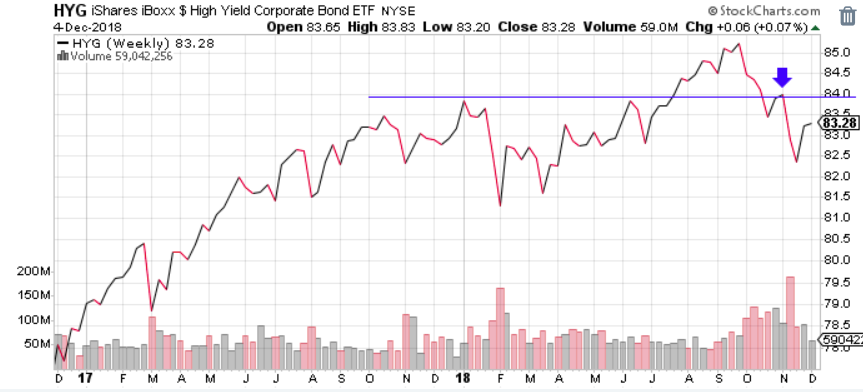
There are two interesting developments in the fixed income sector, highlighted in the two charts below. In the first chart, we’ll take a look at the breakdown in high yield or “junk” bonds. The blue arrow indicates one form of confirmation that a trend reversal is in the works. The price action to the left of the arrow indicates a failed breakout, which means the investment broke through a key price level, but failed to hold it. After failing to hold the price level, this index was then denied on the next attempt to break through the key price level as well. This type of price action leads us to conclude that the credit market is weakening and the probability of prices staying below the blue line is higher than the probability they’ll break out above it.
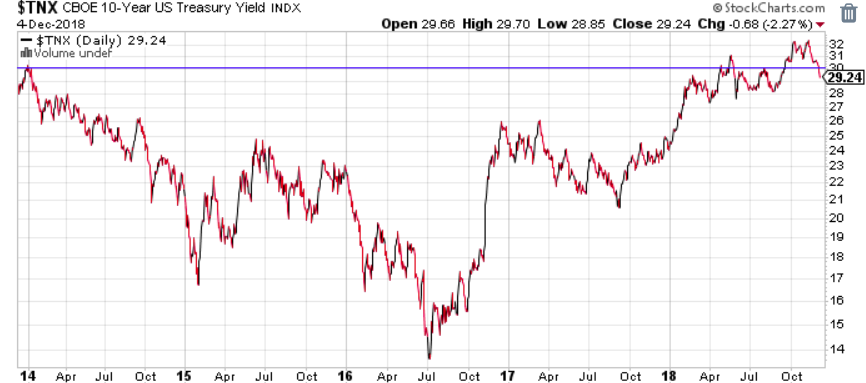
Our second chart shows the yield movement of a 10-year treasury note. We’ve highlighted this movement against a key yield threshold of 3%, indicated by the blue line. In November, the 10 year yield fell below 3%. Simply put, this yield action on the 10-year note indicates bond market participants do not expect many more future interest rate hikes by the Federal Reserve. Since bond prices move inversely with bond yields, if the ten year yield is below the blue line, expect treasury bond prices to rise.
All Terrain Portfolio Update
The All Terrain Portfolio has reduced the majority of risk in the portfolio due to the elevated levels of risk we are seeing in current markets. We will remain diligent in our monitoring of these developing risks.
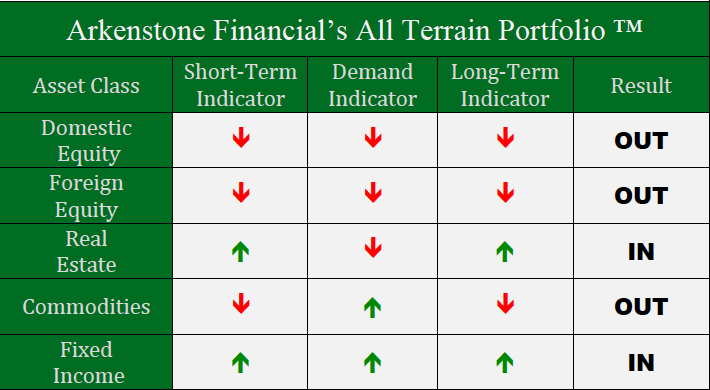
Past performance is not indicative of future results. Other asset classes or investment vehicles may be used in client portfolios and client portfolios may not hold all positions of the model at the same time as the model. This chart and its representations are only for use in correlation to the proprietary timing model by Arkenstone Financial, Registered Investment Advisor. Actual client and All Terrain Portfolio(TM) positions may differ from this representation.
- U.S. Stocks Make New Highs - December 6, 2024
- Rising Rates Create Headwinds - November 8, 2024
- The Fed Finally Cuts Rates - October 10, 2024

Leave a Reply