In a Nutshell: Interest rates continue to rise, causing all of the main investment sectors to fall over the course of the past month. Economic data continues to stay strong in the U.S. and abroad, but inflation is once again a concern globally.
Domestic Equity: The Pre-Election Pause
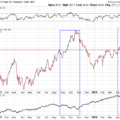
U.S. stocks made a new all time high in October, but ultimately finished lower on the month. While market participants awaited the presidential election, the stock market itself seemed to be positioned to run higher. Stocks have traded into the area of interest around 5700 (top red box) that also coincided with the lower bound of the upward channel for the S&P 500. Given that the first print of the third quarter of U.S. GDP was much stronger than expected at 2.8% (annualized), this positioning of the market could serve as a launching point higher.
Again, our participation model has consistently stayed in bull market territory, traveling from overheated to sufficiently cooled off and recharged to go higher over the past month.
Our sentiment indicator similarly shows a bull market that has cooled from pretty elevated or frothy levels. The stock market has cooled enough to head higher from here.
There were no Federal Reserve meetings in October so short-term rates remained in the 4.75-5% slot. The early November meeting included another interest rate cut of 0.25% by the Fed. However, given the better than expected economic data as of late, along with inflation perking back up, expectations have shifted significantly for future cuts. Right now the market expects at most one more cut after November. The expectation was for three or four more cuts just a month ago.
Global Equity: Taking a Breather
Global stocks cooled off to start the fourth quarter. Global stocks had a rare negative month in October, as rising interest rates continued to put pressure on almost all investment sectors. We have an enormous amount of support still at the blue box below, so coupled with a relatively strong global economic outlook, we’d expect global stocks to get back on track soon.
India, one of the investment stalwarts of 2024, even had a poor month in October. The monster trend we’ve watched for India over the past year finally broke. We are now in a pullback stage that appears to be the type of pattern that tends to resolve higher. We’ll keep a close on this position as it is also possible this investing theme has run its course.
Real Estate: Interest Rate Pressure
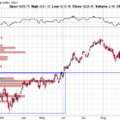
The real estate sector just posted its first negative month since April. The culprit? Rising interest rates. Rates have ripped higher, putting selling pressure on real estate. What we are seeing with price action is a cooling off or consolidation. The chart below shows a pretty common consolidation pattern over the past few months. This pattern often resolves higher once the upper bound of the channel is broken. Given how fast interest rates have risen, real estate has actually held up pretty well. Rates will need to fall if real estate is going higher.
Commodities: Can’t Break Through
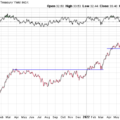
Like much of the last two years, the commodities index took a crack at the “big blue line” below, but couldn’t break through. Given how massive the move was to get to this big spot, its not surprising that the first attempt to break through failed. Given the inflationary impulses we’ve seen over the past few months and recent emergence of Chinese economic growth (which often drives inflation) we’d expect one more crack at the “big blue line.”
We mentioned last month how important the October returns would be for gold due to interest rate headwinds. The precious yellow metal returned 3% last month despite traditional economic factors working against it. This reiterates the massive strength behind this move. We’ll continue to hold a large position here until the trend breaks.
Fixed Income: The Fed Cuts, Rates Go Higher?
Essentially, from the day the Fed first cut short-term rates in September, long-term rates have risen sharply. You can look at the chart below to see that the pace at which rates rose on the U.S. treasury 10-year note was truly remarkable. This backdrop is pretty uncommon, and its rare to see short-term rates falling while long-term rates are rising. There are a number of reasons that could be contributing to this divergence, but the bottom line is rising long-term rates will put pressure on most asset classes. Meaning, diversified investors may find this type of backdrop challenging. Inflation may be the culprit for this interest rate relationship, especially as investors’ slowing economy concerns have been for naught as U.S. GDP continues to cook around 3% annualized. Another piece of the puzzle is the policy response from the Federal Reserve. Even with a warm-to-hot economy, the Fed still cut rates. Investors may feel that the reason to own longer-term bonds (recession protection) has been nullified by the Fed’s willingness to backstop the economy with rate cuts. Thus, if there’s no interest in buying long bonds, the interest rates will rise until there is sufficient interest again.
The “Fed Yield Curve” shows a massive shift in policy expectations given the economic developments over the last 45 days. The market now only expects one or two more rate cuts of 0.25%. While just a month and a half ago the market was looking for four or five cuts by March of 2025, essentially one per month starting in September. This backdrop puts fixed income investors in a lose/lose situation. Owing longer-term bonds will show a loss of the value of the bond with rates rising, while owning short-term bonds will likely show a lowering of future interest rates via Fed cuts. It will be hard to win with fixed income, but the lower risk proposition is clearly owning short-term bonds, which is where we’ll hide out for the foreseeable future.
All Terrain Portfolio Update
The All Terrain Portfolio continues to remain at full allocation as we seek to position for a rising rate and inflationary environment. We still carry about 20% in risk-averse, short-term treasuries less than three years in maturity that are paying interest in the 3.5-4.6% range. The economic data and outlook is tilting towards expansion, but slowing in the rate of expansion as we approach 2025. Inflation and, by extension interest rates, will be the key driver for asset returns as we close out the year. We will follow our indicators as we wait for investment opportunities, but remain agile within our process as new data is presented.
Chart as of 10/31/24
Past performance is not indicative of future results. Other asset classes or investment vehicles may be used in client portfolios and client portfolios may not hold all positions of the model at the same time as the model. This chart and its representations are only for use in correlation to the proprietary timing model by Arkenstone Financial, Registered Investment Advisor. Actual client and All Terrain Portfolio(TM) positions may differ from this representation.
- U.S. Stocks Make New Highs - December 6, 2024
- Rising Rates Create Headwinds - November 8, 2024
- The Fed Finally Cuts Rates - October 10, 2024


Leave a Reply