In a Nutshell: Most risk assets pushed higher while interest rates took a breather to close out the first half of 2024.
Domestic Equity: New All-Time Highs
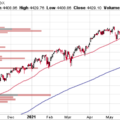
The U.S. stock market closed out a very strong first half of the year, up over 14%. The technically precise trading pattern can be seen over and over this year as volume builds up during consolidations, and then price eventually moves higher. You can see this play out in different shapes in both May and June this year.
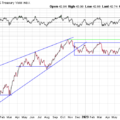
However, we continue to see exceptionally weak participation in this bull market. Below, you can see the S&P 500 index price trading in contrast to the average stock within the index (SPXEW). The difference is the large tech companies like Nvidia pushing the market high. The result is the average stock price has actually been trading lower for the past three months, while the index itself has trended higher.
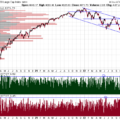
We see the same issue in our participation chart as more lows than highs are being made across the stock universe. The U.S. economy is cooling a bit right now and likely into the third quarter, so we may see this poor participation continue.
Additionally, sentiment is nowhere near overbought while the stock market continues to make new all-time highs.
Short-term interest rate policy remained at 5.25-5.5%. Inflation has proven to be sticky and is trending higher on a six-month basis, so the Federal Reserve has little incentive to cut rates. Market participants came into 2024 expecting six 0.25% rate cuts. Now the market only expects one 0.25% cut to occur this fall.
Global Equity: Stronger Than the U.S.
The global equity chart continues to look very strong. After a brief consolidation following all-time highs, this broad index has held support where needed. The second half of 2024 could show relative strength for global stocks against U.S. stocks as the economic forecast across the globe looks much better than the U.S.
India continues to lead the globe higher and remains one of the strongest economies in 2024. After a brief bout of wild volatility following some unexpected election results (arrow below) India got back on plane and headed higher.
Real Estate: Barely Hanging in There
The real estate sector continues to hold on by a thread, and remains the weakest risk asset investors can own. We continue to see enormous amounts of pricing pressure for commercial real estate in the office and retail sectors and interest rates remain high. We’ll need to see a continuation of interest rates trading lower for real estate to have much upside.
Commodities: Coiling
Commodities continued to consolidate in a very tight range this past month. Trapped between the $32 and $33 price levels, you can see the energy building for a move in either direction. The direction commodities break will likely define the path of inflation for the rest of 2024. Wall Street consensus is that inflation heads lower by year end. However, interest rates are not supporting this view.
Gold continues to look great on a long-term view and now may be ready to run higher. We encouraged patience on the short-term path for gold last month and ended up with a weak month of June for the yellow metal. Gold may now be breaking out higher after a three month consolidation. The gold chart below is a textbook breakout chart, but follow through from here is still needed.
Fixed Income: Interest Rates Are the Key
The relationship between interest rates and risk assets continues to be the most important relationship in the investment world. The line in the sand appears to be around 4.35% on the 10-year U.S. treasury interest rate and we’ve continued to see this previously described relationship with risk assets play out in 2024.
We did witness a trend change in interest rates over the past few months, flipping from a bullish to bearish trend. We are now in a support zone (green box) that will likely prop up interest rates for at least the short term. U.S. economic growth will likely be cooling while inflation will be persistent. As a result, interest rates will likely be highly sensitive to inflation and economic data reports issued each month. An ideal scenario for investment markets would be for interest rates to remain steady near the green box.
All Terrain Portfolio Update
Our model and indicators had us adding back to full positions in real estate. We are now fully allocated across our model but still carry about 12% in risk-averse, short-term treasuries less than three years in maturity that are paying interest in the 5-5.45% range. The economic data and outlook now appear neutral to slightly positive as we move further into 2024. Inflation, and by extension interest rates, will be the key driver for asset returns this year. We will follow our indicators as we wait for investment opportunities, but remain agile within our process as new data is presented.
Chart as of 6/30/24
Past performance is not indicative of future results. Other asset classes or investment vehicles may be used in client portfolios and client portfolios may not hold all positions of the model at the same time as the model. This chart and its representations are only for use in correlation to the proprietary timing model by Arkenstone Financial, Registered Investment Advisor. Actual client and All Terrain Portfolio(TM) positions may differ from this representation.
- U.S. Stocks Make New Highs - December 6, 2024
- Rising Rates Create Headwinds - November 8, 2024
- The Fed Finally Cuts Rates - October 10, 2024


Leave a Reply