In a Nutshell: Interest rates retreated on cooling U.S. economic data, allowing risk assets to rise. Inflation across the globe remains sticky.
Domestic Equity: New All Time Highs
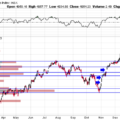
The U.S. stock market made new high marks in the month of May following the 5% decline in April. The market took off from a neutral position (where most of the volume has occurred for the year) and marched through and held the important 5200 level on the S&P 500. From a technical perspective, this is exactly what we want to see from the stock market. This rally seems to be mostly related to interest rates pulling back, which is in response to economic cooling in the U.S. While this cooling may be short lived, our data is suggesting the second half of this year will be a bit weaker than expected. Under the hood, this move is a bit less inspiring as the equal weight S&P 500 still has not made a new high and is trading in the opposite direction of the actual index. This disconnect represents the concentration risk of the few tech behemoths that have led the market higher.
You can see this concentration risk on our participation chart as well. Participation quickly raced back down to neutral, while the stock market was just barely below fresh all-time highs. Not an ideal setup, as we’d like to see more stocks moving to the upside with the index moving higher. However, we’d expect stocks to collectively rally if interest rates continue lower.
Sentiment hit overbought levels while the stock indices were making new highs in May, which is what we’d expect to see. Like the participation chart, sentiment fell rather sharply to near neutral with a minor stock dip. These are buyable dips until the trend changes.
Short-term interest rate policy remained at 5.25-5.5%. Inflation has proven to be sticky and is trending higher on a six-month basis, so the Federal Reserve has little incentive to cut rates. Market participants came into 2024 expecting six 0.25% rate cuts. Now the market only expects one 0.25% cut to occur this fall.
Global Equity: Stronger Than the U.S.
Global equities recovered even better than U.S. stocks making new all-time highs in May. More importantly, it appears global equities have gotten through the big supply area (blue box) that held prices in place for over three months. India remains a powerful economic force and many European nations are exiting a recession (or at least a manufacturing recession) and are experiencing higher economic growth rates than the U.S. When looking at projected economic growth for the back half of 2024, foreign countries look much stronger than the U.S.
Real Estate: Interest Rate Dependent
Real estate had one of the weakest rebounds of all risk assets following the April sell off. You can see below, real estate prices are facing resistance at the blue line just as interest rates approach the key 4.35% level on the U.S. 10-year treasury note. This will continue to be one of the more difficult sectors to invest in and manage. With a very weak fundamental backdrop for office and retail commercial property, this sector will likely be whipped around by interest rates. This sector will carry a lot of volatility with it as well, making it a high-risk, high-reward play.
Commodities: Fake Out?
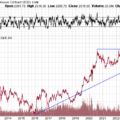
Commodities continued to run higher in May as inflation lingers. The broad commodities index took a shot at passing through the “big blue line,” which is the key price point for determining a long-term trend. Ultimately, this attempt failed as oil has dragged the index down over the past few weeks. The short-term trend is still indicating prices will go higher, but getting through the key price level will be needed for any kind of long-term trend higher.
Gold continues to look great on a long-term basis. However, momentum has stalled significantly on the short-term timeframe. We may need a few months of consolidation or even lower prices before we see significant moves higher.
Fixed Income: Interest Rates Are the Key
The relationship between interest rates and risk assets continues to be the most important relationship in the investment world. The line in the sand appears to be around 4.35% on the 10-year U.S. treasury interest rate. You can see that periods of rising rates above that level have correlated with stock declines over the past year. The opposite is true as well. Stocks have gone up while rates are either under 4.35% or above that level and declining.
As we mentioned in the domestic equity section, the U.S. economy may be a little cooler in the back half of this year than initially expected, especially with inflation remaining higher than expected. There is a chance that slowing economic growth (but not too much) is good for stocks as interest rates stay steady or decline. There is some evidence this scenario is being priced in already. The big upward (blue) channel for interest rates we’ve observed in 2024 looks to have broken as rates go back to the neutral level of 4.2-4.35%. Interest rates would likely stay at this stock-friendly level if economic growth can cool but not turn negative while inflation stays steady but doesn’t increase too much. It’s a bit of a Goldilocks scenario, but it’s not out of the realm of possibility. Our forecasting data for the U.S. economy suggests this could happen as growth looks flat to slightly positive, with inflation flat to moderate for the rest of the year.
All Terrain Portfolio Update
Our model and indicators had us adding back initial positions in real estate and adding to our commodities position. We now carry about 20% in risk-averse, short-term treasuries less than three years in maturity that are paying interest in the 5-5.45% range. The economic data and outlook now appear neutral to slightly positive as we move further into 2024. Inflation and, by extension, interest rates will be the key driver for asset returns this year. We will follow our indicators as we wait for investment opportunities, but remain agile within our process as new data is presented.
Chart as of 5/31/24
Past performance is not indicative of future results. Other asset classes or investment vehicles may be used in client portfolios and client portfolios may not hold all positions of the model at the same time as the model. This chart and its representations are only for use in correlation to the proprietary timing model by Arkenstone Financial, Registered Investment Advisor. Actual client and All Terrain Portfolio(TM) positions may differ from this representation.
- U.S. Stocks Make New Highs - December 6, 2024
- Rising Rates Create Headwinds - November 8, 2024
- The Fed Finally Cuts Rates - October 10, 2024


Leave a Reply