In a Nutshell: Stocks, bonds, real estate, and commodities all traded lower in April due to rising interest rates. Reported inflation continued to run hot to start the year, pushing interest rates higher.
Domestic Equity: Interest Rate Sensitive
The U.S. stock market had a 5% drawdown in the month of April. We describe the technical cracks forming last month, but rising interest rates due to increasing inflation were the main driver of the sell off. Read our fixed income section below for more detail on this interplay between risk assets and interest rates.
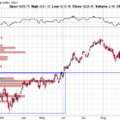
Stocks finished the month recouping some of the losses from the sell off, but in a fairly neutral position. Our participation chart highlights the neutral position below. Potentially the biggest positive take away is that we haven’t revisited the green line indicating bad market participation. Typically, we like to see bull markets live around the blue line up to the red line. Since 2022, we haven’t seen selling check up prior to the green line. A push back up to the red line would go a long way in confirming positive market structure and participation.
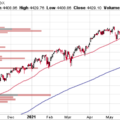
Sentiment is in a similar spot as participation. While we had a much needed cool off in stocks, sentiment still remains decent. We want to see sentiment stay fairly positive. Like our participation charts, in bull markets sentiment shouldn’t spend too much time near the green line.
Interest rate policy remained at 5.25-5.5%. What’s interesting now in the interest rate market is that the combination of the Federal Reserve’s willingness to keep rates increased while risk assets rally higher (in anticipation of rates cuts, of course) is that the interest rate market has adjusted its expectations from a 1.5% point reduction in 2024 to 0.25% point reduction in just four months. The Fed communicated that they still have work to do on inflation, but they seem willing to let inflation run above their 2% target. Until the stock market or economy cools, the Fed has little incentive to cut.
Global Equity: Stronger Than the U.S.
Global equities experienced a drawdown in April, like the U.S., but the drawdown wasn’t as deep for global equities. While we are still in a big resistance zone (blue box below) the relative strength when compared to the U.S. and the strong trend higher have us optimistic for global stocks.
Most of the strength from global equities can be sourced back to Europe. Many European countries are coming out of a recession, so the economic growth rates are a bit higher than our domestic economy. Germany, for example, is looking very strong with an intact uptrend and well above the prior highs in 2022. The rest of 2024 looks quite constructive for European equities.
Real Estate: The First Rate Casualty
Real estate got hit hard by rising interest rates in April. The support area that was tested and held in February broke in April as interest rates pushed higher. The gray (real estate) and green (interest rates) lines show a perfect inverse relationship as they trade in near symmetry in opposite directions. As we note in the fixed income section below, risk assets seem to struggle when the 10-year U.S. treasury interest rate is over 4.35%. Real estate is perhaps the most sensitive of all sectors to rates and was the first to lose support. We’ll keep an eye on this sector, but it will likely be a challenging sector as long as rates are heading higher.
Commodities: Is Inflation Back?
Commodities held strong in April, maintaining a short-term uptrend but below major resistance. The big theme of the economic data that was released in April was inflation. By just about every measure, inflation is heating up again in 2024. As long as commodities trade under the big blue line below, inflation will likely be sticky and lingering. Above the line and inflation will likely become a headwind for consumers.
Gold has held up well after its incredible start to the year. This strength is particularly impressive as interest rates have been rising, as the two tend to trade inversely. After breaking through a resistance level that held for four years, we think there is still quite a bit of headroom for this precious metal.
Fixed Income: Rate Pressure Is Back
Last month we proposed the idea of interest rates running higher and creating pressure on risk assets. We saw just that move play out. The 10-year U.S. treasury interest rate traded over 4.7%, pushing up to levels we saw last fall. Stocks sold off as a result. As the chart shows below, stocks and bonds are trying to sort out an equilibrium. As of right now, the line in the sand appears to be around 4.35% on the 10-year U.S. treasury interest rate. You can see that periods of sustained trading over this level shows stocks selling off.
The reason for the sell off with rates running higher is generally about inflation. Higher inflation (which we saw in the first four months of 2024) pushes rates higher. Higher rates may choke out the expected moderate GDP growth for 2024. The chart below shows blue channels where inflation was driving interest rate increases. We see those risk asset sell offs coincide with these big inflation pushes beyond equilibrium (the blue box).
For now, and as has been the case for the past two years, interest rates are driving just about all assets.
All Terrain Portfolio Update
Our model and indicators had us removing real estate and adding commodities. We now carry about 30% in risk-averse, short-term treasuries less than three years in maturity that are paying interest in the 5-5.45% range. The economic data and outlook now appear moderately strong as we move further into 2024. Inflation and, by extension, interest rates will be the key driver for asset returns this year. We will follow our indicators as we wait for investment opportunities, but remain agile within our process as new data is presented.
Past performance is not indicative of future results. Other asset classes or investment vehicles may be used in client portfolios and client portfolios may not hold all positions of the model at the same time as the model. This chart and its representations are only for use in correlation to the proprietary timing model by Arkenstone Financial, Registered Investment Advisor. Actual client and All Terrain Portfolio(TM) positions may differ from this representation.
- U.S. Stocks Make New Highs - December 6, 2024
- Rising Rates Create Headwinds - November 8, 2024
- The Fed Finally Cuts Rates - October 10, 2024


Leave a Reply