In a Nutshell: Interest rate volatility increased, providing a volatility spike in all risk assets. The month of October saw big swings, but no real directional moves for stocks in the U.S. and abroad.
Domestic Equity: Target Acquired, Bounce Ensues
The U.S. stock market finished October up for the month, but it wasn’t without drama. Over the last two weeks of October, stocks managed to both fall and rise by about 6% in each direction. We previously mentioned that 4225 would be a target and that hit last month. The real bounce came after the high volume area for 2023 was finally hit and defended at 4150. This move fulfills our call back in August for the market to trade back down from the low volume 4600 area down to the 4200 range. We got the big bounce, but now face another high volume area near 4400. It seems likely that for the rest of 2023 the 4200 and 4400 levels will hold the key for where we finish the year. Breaking either barrier will allow for stocks to move in that respective direction.
Our participation chart worked its way down to oversold territory again in October. To restate what we’ve seen since January of 2022, this is not a bull market behavior. We have not gotten overbought (red line) since 2021, and have spent the majority of the last two years in negative territory.
Our sentiment indicator got back into oversold territory (green line) just as major support for the year was getting tapped. This combination provided for a great short term bounce. However, as we’ve stated previously, every overbought (red line) reading has led to an oversold (green line) reading since this stock market peaked in January of 2022. This isn’t the type of behavior we’d expect from a bull market. The bull run from April 2020 to the end of 2021 showed the exact opposite characteristic of not once getting oversold after being overbought.
Short-term interest rates stayed at 5.25-5.50% through the month of October. The Federal Reserve members continued to talk tough about more future hikes and dismissing future cuts. The bond market is finally taking the Fed at its word as rates are projected to be steady for the next nine months. It seems now that any future hikes or cuts will be spurred on by after-the-fact analysis by the Fed of economic and inflation data. Visibility for any market forecasting remains low for the next six-to-nine months.
Global Equity: Back in the Box
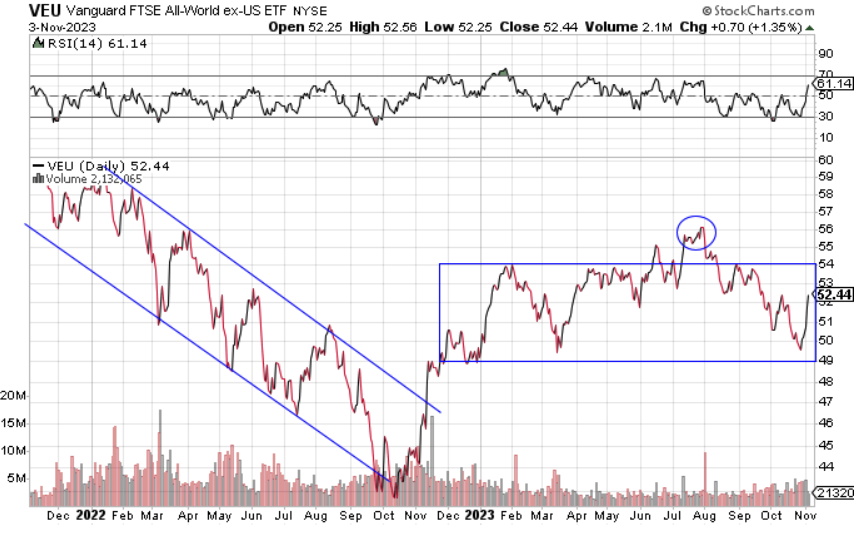
Global equities bounced back at the end of October, but continued to stay in the directionless trading range defined by the past year. There isn’t a whole lot to be excited about globally, with Europe slowing and fighting inflation and China taking drastic stimulative measures to try to kick start their flailing economy.

The few countries, like Japan and India, that had inspired some hope for foreign investment are also starting to fade as Japan’s equity market has experienced a significant pull back. There isn’t much to be excited about with global equities.
Real Estate: Nice Bounce, But
Real estate had a nice rebound in October as interest rates backed off and provided a boost to all risk assets. A new cycle low was made in October before real estate rallied to close out the month higher. The fundamental headwinds for real estate still prevail, so it’s hard to view this move as anything more than a countertrend rally within a longer term trend lower. From a technical perspective, the chart below shows we are running into an area that could slow the rally or stop it all together. The price action in this sector will continue to be heavily dependent on short-term interest rate moves. If rates fall, price will head higher, and visa versa. If rates and price fall together, that’d be a good indication we are approaching or in a recession – an item we’ll monitor closely.
Commodities: Still Make or Break Time
The commodities sector has taken another shot at the key level illustrated below by the blue line. The importance of this support and resistance line can’t be overstated. This level has been tested on both sides 11 times in the last two years. If price breaks above the line, a big move higher would be in the cards. If it failed to break though, commodities would likely resume the longer-term path lower off of the cycle peak in June of 2022.
Gold has had one of the more exciting two-month runs of any investment in the financial universe. After a 7% drop in the last two weeks of September, gold rebounded off of a key support area nearly 10% in October. The remarkable move down and up followed in lockstep with interest rates as they raced higher to close out September, and have dropped significantly since the calendar turned to October.
Fixed Income: Wild Moves
Interest rates for the 10-year U.S. treasury bond have cooled off after the major jump to 5% by mid-October. It took the bond market about 30 days to trade from 4.25% to 5%, an 18% increase. That move higher was followed by a near 10% down move to the 4.5% range in just a couple weeks. This interest rate volatility makes it hard for bond investors, as well as difficult to interpret what these moves mean in the broader economic sense. For now, it’s best for investors to hide out in shorter duration bonds.
A check in on the bond version of the recession tracker: We see that we are continuing to “uninvert” which is generally not a positive sign for the economy. However, it is worth calling out that this current iteration of uninversion is a bit atypical, as longer-term rates are catching up with short-term rates. The more traditional uninversion is when short-term rates drop down to falling longer-term rates. Inflation is the reason for this difference. We’ll likely know over the next few quarters if this context matters for avoiding recession or not.
All Terrain Portfolio Update
Our model and indicators were again forced to sell risk assets as this highly volatile and whipsawing market continues to have big moves within short time periods. We now carry about 80% in risk-averse, short-term treasuries less than three years in maturity that are paying interest in the 5-5.45% range. The economic data and outlook continue to be weak as we close out 2023 and move into 2024, so we will follow our indicators as we wait for investment opportunities, but remain agile within our process as new data is presented.
Past performance is not indicative of future results. Other asset classes or investment vehicles may be used in client portfolios and client portfolios may not hold all positions of the model at the same time as the model. This chart and its representations are only for use in correlation to the proprietary timing model by Arkenstone Financial, Registered Investment Advisor. Actual client and All Terrain Portfolio(TM) positions may differ from this representation.
- U.S. Stocks Make New Highs - December 6, 2024
- Rising Rates Create Headwinds - November 8, 2024
- The Fed Finally Cuts Rates - October 10, 2024


Leave a Reply