In a Nutshell: Interest rates shot higher at a blistering pace in September, causing almost all risk assets to sell off across the globe and giving investors few places to seek refuge.
Domestic Equity: Letting Some Air Out
The U.S. stock market fell about 5% in the month of September as nearly all risk assets were hit hard by rising interest rates. The roughly 8% trip lower from the July highs hit our target of 4225 that we called out over the summer and reiterated last month. Where the market goes from here will set the tone for the remainder of the calendar year. With stocks pulling back into the 4200 area, market structure is much stronger here to support a bounce higher. However, if this support area does not hold, our current sell off could intensify.
Our participation chart is way back down into bear market territory and approaching levels that we haven’t seen since the regional bank crisis in March of this year. This weakness really illustrates the weak market we’ve dealt with all year from a participation perspective. Outside of a few large mega-cap tech companies, the stock market has been very weak.
Our sentiment indicator got back into oversold territory (green line). This is another discouraging sign as strong markets usually don’t fall into oversold territory from overbought (red line). Unfortunately, this overbought to oversold behavior has been a hallmark of the stock market since the cycle peak in January of 2022. At the very least, volatility is still high, and it’s too early to say we are back in a bull market.
Finally, to illustrate the point of how weak the market has been outside of a few large companies that have pushed the market higher, we have the equal-weight stock chart below. This chart gives all S&P 500 companies the same weighting, stripping out the effect of large companies. This equal weight index is down 2% on the year, while the stock market is up 10%. Said another way, most stocks have been losers this year.
Short-term interest rates stayed at 5.25-5.50% through the month of September. However, the language from the Federal Reserve over the past month has finally injected some fear into the bond markets. Despite not raising rates, the Fed continued to talk tough about more future hikes and dismissing future cuts. This feedback sent interest rates across longer maturities much higher and the “higher for longer” mantra seems to have finally set in with the bond market. As of now, it appears to be a coin flip if short term rates will be raised or not and will likely be dependent on future economic and inflation data.
Global Equity: Failed Breakout
Global equities continued to fall back into the blue box, now down 10% from the late July highs for the year. Economic weakness continues to spread throughout the globe, specifically through China and Europe.
India and Japan continue to buck the global trend and have posted strong economic production, making these countries one of the few spots for investors to hide out.
Real Estate: Few Worse Options
Real estate had a brutal month of September, selling off over 11% for the month. Interest rates continuing to rip higher has again put tremendous pressure on a very weak sector. Real estate is now testing its cyclical lows, set about a year ago. The sector is down 33% since the cycle peak in January of 2022, making it one of the worst risk assets you could own over that time period. We’ll continue to avoid this sector as a whole.
Commodities: Make or Break Time
The commodities sector pulled back with all other risk assets after being rejected by the key level illustrated below by the blue line. The importance of this support and resistance line can’t be overstated. This level has been tested on both sides 10 times in the last two years. If price breaks above the line, a big move higher would be in the cards. If it failed to break though, commodities would likely resume the longer-term path lower off of the cycle peak in June of 2022.
Another victim of interest rates running higher is gold. Gold held up well in the face of rising rates for most of this year, but ultimately plunged in the back half of September. You can see below gold is running into what should be a support level, but is now in a bearish trend dating back almost six months. We’ll need to see interest rates cool off to be interested in the yellow metal again.
Fixed Income: Pure Carnage
Interest rates for the 10-year U.S. treasury bond are now trading at 16-year highs. Last month we saw the breakout from the blue box. September brought an explosion through the October 2022 highs. All said and done, interest rates went up 13% in just one month.
The long bond, or 30-year bond saw rates make a similar, vicious move higher
How remarkable is this move? The chart below shows that an index fund that tracks the long bond is now down 47% from its peak in 2020. Putting this incredible move in a different context, if this bond index fund were the U.S. stock market it would be tied for the third worst crash ever only trailing the 1929 and 2008 crashes. Simply put, we have not seen this sort of bond market environment over the last five decades.
This rise in interest rates has also provided some interesting context to the yield curve inversion we track. The green line tracks the difference between the 10-year U.S. treasury rate against the two year. When this goes negative, a recession usually follows. Typically, the real damage in the stock market occurs not when this inversion occurs, but when the green line “uninverts” or starts to become less negative or positive. With our recent surge in longer-term interest rates we are again in the process of “uninverting.” While yield curve inversion tends to be a poor timing device for calling recessions, history tells us that the process of uninverting means we are getting closer to a recession, if we are going to have one.
All Terrain Portfolio Update
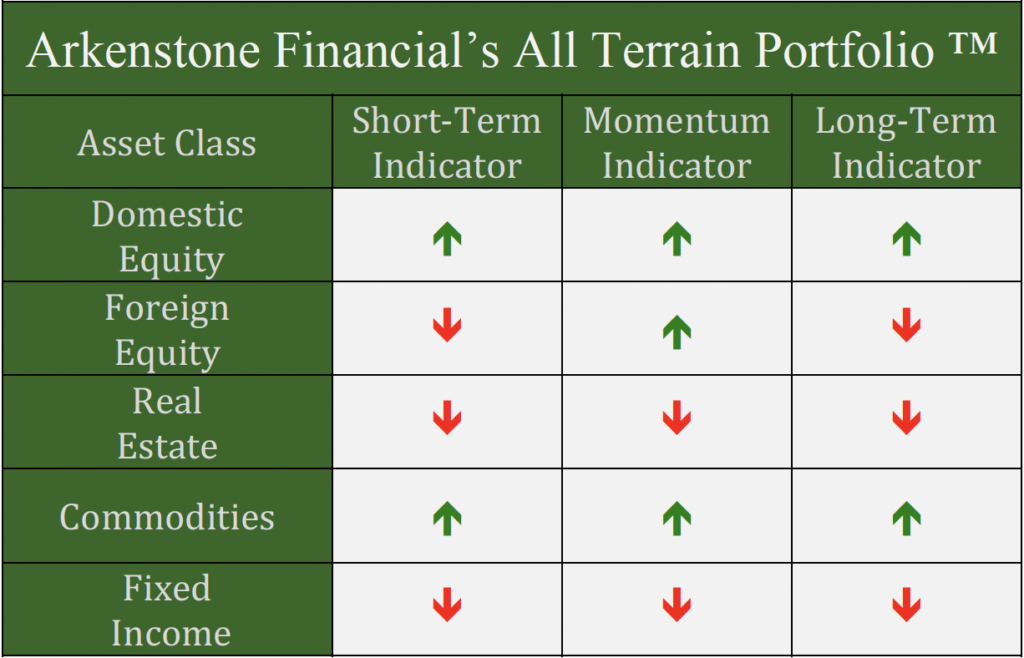
Our model and indicators dictated that we reduce risk as many equity positions and all precious metal positions were removed. We now carry about 65% in risk-averse, short-term treasuries less than three years in maturity that are paying interest in the 5-5.45% range. The economic data and outlook continues to be weak as we close out 2023 and move into 2024, so we will follow our indicators as we wait for investment opportunities, but remain agile within our process as new data is presented.

Past performance is not indicative of future results. Other asset classes or investment vehicles may be used in client portfolios and client portfolios may not hold all positions of the model at the same time as the model. This chart and its representations are only for use in correlation to the proprietary timing model by Arkenstone Financial, Registered Investment Advisor. Actual client and All Terrain Portfolio(TM) positions may differ from this representation.
- U.S. Stocks Make New Highs - December 6, 2024
- Rising Rates Create Headwinds - November 8, 2024
- The Fed Finally Cuts Rates - October 10, 2024


Leave a Reply