In a Nutshell: Many risk assets had another solid month of returns, although they look primed for a breather. Inflation may be bouncing back, with interest rates pushing to new highs for 2023.
Domestic Equity: The Air Is Getting Thinner
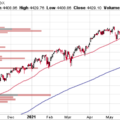
The U.S. stock market rose about 3% in the seasonally strong month of July. Stronger than expected second quarter U.S. GDP was part of the push higher for stocks, as economic data continues its trend of “better than expected.” That’s the good news. The bad news is that the positive GDP came primarily on the back of unexpectedly large government deficit spending – historically high given our non-emergent state of the economy. Additionally, this recent pop in economic data is still within a longer-term slowing cycle. With respect to the stock market, you can see below that when we examine the volume at certain price levels, most of the year’s volume is in the 3800-4200 box we’ve highlighted before. The volume is very light above that box, making for weak market structure. If there are any catalysts for stocks to go lower, the blue line at 4225 seems like a likely target.
Our participation chart gives us one of our best reports of the year, coming in positive and above the February highs. This indicates that the stock rally is now becoming much more broad based. Prior to June, most of the stock rally was dominated by a few large companies. Seeing more stocks participate in the upside is extremely positive.
Our sentiment indicator has us cooling our jets in the short term as a pullback at this point in time would be healthier for the market to go higher. While we expect a pullback in the short term, the depth of the pullback will be telling. Ever since we turned the calendar to 2022, every stock market move from our sentiment indicator past the red line (overbought/exhausted to the upside) we’ve seen a pullback of at least 7.5% – which would put that 4225 level from above firmly in range. These pullbacks have all run to the green line in sentiment, which is oversold, exhausted to the downside, very typical bear market behavior. You’ll notice prior to 2022, when we were in a bull market, crossing the red line resulted in a much lower pullback. So this next pullback will be incredibly informative on the market environment – does the market respond as if this is a bull or bear market?
As anticipated, the Federal Reserve raised rates again in July, taking the benchmark rate to the 5.25-5.50% range. This is the highest level short-term rates have been in two decades. Even more surprising is that yet another rate increase seems possible by year end. This represents a major shift in expectations from the start of the year. As long as the Fed’s preferred inflation measure PCE (not CPI) remains sticky, and the economy continues to be not as bad as expected, rates will likely increase. The combination of increased government spending to boost the economy, inflation potentially reigniting (see our commodities breakdown), and the policy lag of raising interest rates starting to trickle into the economy all coming to a head in the next few months will make the Fed’s job of controlling inflation exceptionally difficult.
Global Equity: Needs to Hold
Global equities were up marginally for the month of July. The year-to-date structure of the foreign markets (below) looks a lot like the U.S. stock market structure, but price is much more condensed. In fact the foreign stock “blue box” is already being tested as we move into August. Global stocks need to show resilience here.
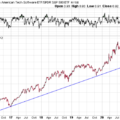
Stocks in India have been on a tear as of late. Like Japan, who we highlighted last month, India has a decent economic outlook for the next 6 to 12 months, which is unlike the vast majority of the globe. The channel below is being tested, and is fairly steep, so a pullback may be in order before a march higher ensues.
Real Estate: Mortgage Rates Keep Climbing
July was a green month for real estate, but the sector continued to lag other risk assets like stocks. Before even considering taking a shot at those February highs from earlier this year, the support level indicated by the blue line below needs to absorb any downside moves. Sustaining any sort of rally in real estate will be challenging, as interest rates are breaking out and heading higher, which in turn is sending mortgage rates higher. The current real estate market is nuanced but, generally speaking, higher borrowing costs should put pressure on real estate prices.
Commodities: Inflation Back on the Rise?
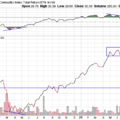
The commodities sector was green again in July, capping off a 14% move higher in just two months – a significant move in such a short period of time. Just about every raw good that we track is up over that time period. Headline inflation (CPI) has been slowing for over a year, but that streak could be in jeopardy over the next few months as everything from orange juice to oil has gone steadily higher. The big blue line below still remains a key line in the sand for the sector. Moving above the line almost certainly pushes inflation higher.
Oil has been one of the primary drivers of higher commodities prices, with a 20% move higher in a little under two months. Technically, this move has triggered a breakout from a downtrend that’s been evident for about a year. A move through the blue horizontal line would indicate a trend reversal and would put a lot of pressure on the consumer at the gas pump. This recent pop in commodities could trigger the Federal Reserve to raise rates again.
Fixed Income: Interest Rates Breaking Higher
After a yearlong consolidation, interest rates seem to be breaking higher. Below you can see the 10-year U.S. treasury yield at the top of the blue box, threatening to head higher.
The 30-year U.S. treasury yield has already broken out (green line) and is heading higher.
What makes this move higher so interesting is that it seems to be catalyzed by the potential for inflation to go higher and the recent ratings downgrade the U.S. received. Given the higher than normal probabilities of recession that our research group and others are forecasting (the yield curve is still inverted) over the next few quarters, one would expect longer-term interest rates to fall. Instead, rates have risen, putting investors in a bind. Add in the fact that the Federal Reserve may raise short term rates again this year, and the bond market has become an absolute mess. In fact, we are in the midst of the worst aggregate bond drawdown in the last 50 years, and nearly five percentage points worse than the next worst period. The kicker is that our current drawdown has already lasted twice as long as the prior worst period. With bonds – a key component of any portfolio – being underwater over the last three years, investor returns have been muted when compared to historical returns.
All Terrain Portfolio Update
Our model and indicators dictated that we add another small increment of risk to the All Terrain Portfolio model. This increase in risk was realized in small stock allocations and commodities. Due to rising rates we were forced out of our longer term bond positions. However, a good portion of our model remains in risk-averse, short-term treasuries that are paying interest in the 5.35% range. Economic data and outlook continues to be weak for the second half of 2023, so we will follow our indicators as we wait for investment opportunities, but remain agile and follow our process as new data is presented.
Past performance is not indicative of future results. Other asset classes or investment vehicles may be used in client portfolios and client portfolios may not hold all positions of the model at the same time as the model. This chart and its representations are only for use in correlation to the proprietary timing model by Arkenstone Financial, Registered Investment Advisor. Actual client and All Terrain Portfolio(TM) positions may differ from this representation.
- U.S. Stocks Make New Highs - December 6, 2024
- Rising Rates Create Headwinds - November 8, 2024
- The Fed Finally Cuts Rates - October 10, 2024


Leave a Reply