In a Nutshell: Nearly all investment markets were flat in April. The Federal Reserve raised rates one last time, while regional bank stress continued to spread in the U.S.
Domestic Equity: Still Stuck
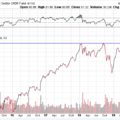
The U.S. stock market went nowhere in April. This comes as a bit of a surprise as April is typically the strongest month of the year for stocks. Below, you’ll see we are coming up on six months of range-bound trading in the 3800-4200 area we’ve been highlighting for the past few months. Typically, the longer markets stay in one area, the larger the move once the range is broken. Patience will be key for investors as we await a breakout from this range.

Looking under the surface, our participation indicator shows that we continue to stay in negative territory. In fact, participation has actually fallen into further negative territory with the broader stock index staying flat. It’s a disconcerting sign, as this shows the market is weakening under the surface.

Our sentiment indicator gives us more of the same with another neutral reading and hardly any change from last month. When you put price, participation and sentiment together, the result is a neutral market near the top of its range and weakening; a recipe that likely keeps us range bound until we get economic catalysts in either direction.

The Federal Reserve raised interest rates 0.25% again in the early days of May, taking rates to the 5.00-5.25% range. The Fed held the course of increasing interest rates even after significant interventions in the banking system that were, at least in some part, caused by rising interest rates. The bond market is positioned as if this May interest rate increase was the last one of this hiking cycle. The bond market is pricing in interest rate cuts of 0.75% by year end. The two-year U.S. treasury interest rate is about 1.4% less than the three-month U.S. treasury interest rate, indicating more cuts throughout next year. The Fed has stated they are still concerned with inflation as it has remained sticky and begun to creep into wages. If the Fed ends up cutting rates this year, given our current backdrop of slowing economic growth and sticky inflation, it will be to prop up a worsening economy.
Global Equity: Stuck as Well
Global equities held up decently in April, but are starting to show technical weakness, while staying within their own trading range.

The fundamental weakness is starting to show up as well with global economic hub, China, which is now projected to show economic deceleration throughout the back of the year. China’s economic resurgence was good while it lasted, but brief. You can see below: Price is on the verge breaking down and heading lower for China.

Real Estate: Couldn’t Be More Directionless
Real estate pricing maintained its aimless trading, staying below the most recent up trend, but above the longer term downtrend. We continue to bounce around in the triangle of neutrality as marked by the arrow below. Macro headwinds are aplenty in this sector as high mortgage rates and increasing vacancy plague commercial real estate in particular. With all of the banking stress at regional banks – who are the largest lenders of commercial real estate – credit creation and lending for real estate will likely slow. A weak to neutral technical chart and concerning fundamentals have us on the sidelines with this sector.

Commodities: Gold Stays Hot
The commodities sector looks like it is finally ready to head lower as it appears the blue line below has now flipped from support to resistance. Given that oil is now rolling over despite OPEC production cuts limiting supply, we are likely seeing a demand issue for oil and other raw goods. Not a good sign for future economic production.

Gold continues to shine, as any sign of weakness continues to be bought up by investors (and central banks). We were looking for a pull back last month, given the surge in March, but not much was given as the $2000 level held up well. New all-time highs are not far away now, and if hit, could push the precious much metal higher.

Fixed Income: What is Going On In the Rates Market?
You can see the 10-year U.S. treasury interest rate continues to tip-toe the edge of a cliff at the 3.4% level, as it has for months now. This is a truly ominous sight, as longer-term interest rates historically fall precipitously as an economy contracts. This level will be very important to watch going forward.

We’ve talked previously about how an inverted yield curve tends to precede recessions. The 10-year versus two-year yield curve has already inverted and is now in the process of “univerting” – a bad sign for economic growth. How wild is the interest rate market right now? It’s record setting. When we look at more late cycle yield relationships we’ve never had wider spreads. Below you’ll see the 10-year versus the three-year yield showing record spread of nearly 2%. Meaning, the bond market is paying out 2% less yield (annually) to hold a bond almost 10 years longer than a three-month bond.

Looking even closer in when we view the two-year versus three-month spread we are looking at another record with the two-year U.S. treasury priced to pay 1.4% (annually) less than a three-month treasury bill. We’ve never seen spreads this wide before. The bond market is saying, loud and clear, that it expects economic contraction ahead and for the Federal Reserve to cut rates significantly to try to buoy a falling economy. The question is: Is the bond market right?

All Terrain Portfolio Update
We continue to hold small positions in defensive stocks, precious metals and global equity. This month, we added to our fixed income holding of U.S. treasuries. The vast majority of the model remains in risk-averse, short-term treasuries that are paying interest in the 4.7% range. Economic data and outlook continue to be weak for the first half of 2023, so we will remain risk averse and agile until the data improves. We will continue to wait for investment opportunities and, in the meantime, follow our indicators and process to adjust risk as new data is presented.

Past performance is not indicative of future results. Other asset classes or investment vehicles may be used in client portfolios and client portfolios may not hold all positions of the model at the same time as the model. This chart and its representations are only for use in correlation to the proprietary timing model by Arkenstone Financial, Registered Investment Advisor. Actual client and All Terrain Portfolio(TM) positions may differ from this representation.

- Risk Is Rising - November 6, 2026
- Rising Rates Wreak Havoc - October 9, 2026
- Stocks Pause, Await the Fed - September 4, 2026


Leave a Reply