In a Nutshell: Banking stress across the globe sent stocks lower for several weeks, until they rebounded in mid-March. Meanwhile, interest rates plunged and haven’t come back.
Domestic Equity: Still Without Direction
The U.S. stock market did little to instill directional conviction, despite a slightly positive return for the month after a brief banking scare. You can see below we have been moving mostly sideways for months now and we remain trapped within a big range of 3800-4200, which will surely provide some head fakes as economic data comes in over the coming months.
Looking under the surface, our participation indicator shows that we are back in negative territory despite the stock market not having made any new lows in the last five months. This is not a healthy sign and tells us the rally has been led by just a few companies. In fact, about 90% of our year-to-date returns in the S&P500 can be attributed to about five large technology companies because of their sheer size. Said another way: We have not had broad stock participation despite higher index prices.
Our sentiment indicator gives us more of the same with another neutral reading. This neutral sentiment did come off of deeply negative sentiment during the banking scare this past month. Overall, the stock market looks like it is in a holding pattern.
The current holding pattern makes sense as companies will be reporting earnings in just a few weeks. Below you can see on our earnings tracker we have been seeing earnings decline for the last four quarters. Although earnings, in aggregate, are above the long-term trend (blue lines) we just passed through the short term trend (curved blue line). This movement through the curve line has provided a lagging, but confirming indication of an economic slow down in the past. So the question to be answered is this: After a lengthy decline in earnings, have declining earnings bottomed or are they headed lower from here? Investors are likely waiting for this quarter’s earnings to make directional bets, hence the holding pattern. It would make sense we see earnings decline lower to the top of the historical range at the 160 level. However, the Covid era of monetary, fiscal and health policy has distorted a lot of financial metrics from their historical paths, so we continue to wait and see the new data that comes in.
The Federal Reserve raised interest rates 0.25% again in March, taking rates to the 4.75-5% range. The Fed held the course of increasing interest rates even after significant interventions in the banking system that were at least, in some part, caused by rising interest rates. However, forward-looking rates have pulled a complete 180 as year-end projections for interest rates went from 5.5% to 4% in just a few weeks. Additionally, the bond market is projecting that there will be no more interest rate increases in this cycle, which runs counter to Fed communication. The Fed will be able to assess bank earnings and preliminary first quarter GDP before making their next decision in early May.
Global Equity: The Best of the Bunch
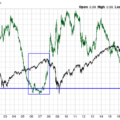
Global equities had an eventful month of March courtesy of global banking concerns. The support level (blue horizontal line) that we wanted to see hold on a pullback was breached, but recaptured. Given the level of concern for banks (specifically Switzerland) in Europe, we can’t exactly interpret this price action as bullish. Recapturing the support level (after failing) is more likely a product of a whipsaw in positioning once the banking fires were put, and less about renewed hope of economic growth over the coming months. The banks start earnings season off in mid April, which will likely have global impacts. Global equities have been stronger than U.S. equities over the last six months, but it will need to see strong earnings in April to keep it going.
Real Estate: Not Good, Could Be Worse
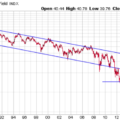
Real estate pricing is currently in a directionless location, dropping below the most recent up trend, but above the longer term downtrend. You can see the triangle of neutrality as marked by the arrow below. Macro headwinds are aplenty in this sector as high mortgage rates and increasing vacancy plague commercial real estate in particular. We’ll need to be blown away by positive price action to be compelled to own this sector with any sort of conviction.
Commodities: Gold Pops
The commodities sector continues to head lower, but in slow fashion. The downtrend continues to hold and push the sector lower. It’s no surprise commodities peaked with inflation last June and has consistently traded in lockstep with inflation since.
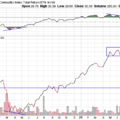
We mentioned last month that gold had the potential to move higher, and did it ever. Gold popped off the support line below just as interest rates were peaking. Gold made an 11% move higher over the month in nearly a straight line. The volume associated with this move was massive, as you can see at the bottom of the chart below. Big moves on big volume usually have staying power, so although a cool off would be appropriate, the yellow metal has a real shot at making new all-time highs in the coming months.
Fixed Income: Interest Rates Rolling Over
Interest rates continue to stay highly volatile, with the 10-year U.S. treasury falling about 15% lower to 3.34% from 4%, in just a month. We mentioned last month that despite the big February rally, rates were likely in the process of rolling over. It appears the fourth time was the charm for interest rates as the stress in the banking system pushed rates below the blue support line in the 3.5% area. Longer-term interest rates falling indicates the bond market thinks growth and inflation will fall in the future, so seeing rates break down here, indicates tough times may be ahead for the economy.
Checking in on our yield curve inversion chart we see after making a record low inversion in February, the curve is now “uninverting.” Meaning the green line below is heading from a negative number back to the positive area. This type of movement is consistent with recessionary behavior in 2000 and 2008. Interestingly, it wasn’t the inversion that prompted de-risking, but instead it was when the curve became less inverted. While an inverted yield curve is a poor market timing mechanism, when the inversion curve (green) goes from negative back to positive it is because rates were cut to support an ailing economy and a recession is underway. To say the least, this current yield curve movement has our attention.
We reiterate that interest rates will be the key in 2023, and something we’ll continue to monitor to assess all risk assets this year.
All Terrain Portfolio Update
We continue to hold small positions in defensive stocks, precious metals and global equity. This month, we expanded our fixed income holding into U.S. treasuries with longer duration. The vast majority of the model remains in risk-averse, short-term treasuries that are paying interest in the 4.7% range. Economic data and outlook continue to be weak for the first half of 2023, so we will remain risk averse and agile until the data improves. We will continue to wait for investment opportunities and, in the meantime, follow our indicators and process to adjust risk as new data is presented.
Past performance is not indicative of future results. Other asset classes or investment vehicles may be used in client portfolios and client portfolios may not hold all positions of the model at the same time as the model. This chart and its representations are only for use in correlation to the proprietary timing model by Arkenstone Financial, Registered Investment Advisor. Actual client and All Terrain Portfolio(TM) positions may differ from this representation.
- U.S. Stocks Make New Highs - December 6, 2024
- Rising Rates Create Headwinds - November 8, 2024
- The Fed Finally Cuts Rates - October 10, 2024


Leave a Reply