In a Nutshell: Stocks rallied again in November, but this stock rally saw commodities and long-term interest rates fall, raising concerns of falling global demand.
Domestic Equity: Make or Break Time
Stocks continued their rally off of the October lows through November. This rally has now butted up against a key trend line that represents the upper end of the channel stocks have traded in throughout 2022. Rejection here would make sense as this trend level has held all year. Pushing through this channel and holding would be initial evidence of a trend change, but with more proof needed to confirm the trend change.
Again, reviewing our broad market strength indicator we see that more stocks are going down than going up, a characteristic of bear markets. If this indicator pushes into positive territory, that would be more evidence of a trend change.
Below is a sentiment indicator that is calibrated with stock market prices. Stock market prices traveling above the red line indicate that sentiment is extremely positive and ripe for a pull back; below the green line indicates the opposite. We’ve crossed the red line again and are in extremely positive sentiment territory for investors. You’ll also notice all three prior instances in 2022 occurred within a bear market and at local topping points. A pullback here seems likely, but the big question will be how far does it go and where does the next push higher take us? This market response will likely be confirmation of a new bull market or continuation of our current bear market.
Part of the euphoric rise in stocks is due to Federal Reserve policy with respect to interest rates. Interest rates are projected to go up 0.5% in December, which is a slowed pace from the last few rate increases of 0.75%. As of now, the market is expecting another 0.5% in February, where the Fed is expected to pause rate hikes with short-term rates around 5% for the remainder of 2023. Stocks rallying based on the prospect that interest rates will be higher in one year seems to be a bit of a disconnect. With the Fed so resolute in keeping interest rates high to stop inflation (through demand destruction) it appears, for better or worse, policy will push the markets up and down for the foreseeable future.
Global Equity: Signs of Life
The global equity markets had their best month of 2022, up nearly 13% on the month. From a technical perspective, this was a big move that broke through a year-long (steep) down trend channel. At this point, the previous August high is still providing resistance, but global equities have been so beaten up in 2022 that this move is a welcome sight. Over 75% of foreign countries are expected to show economic contraction in the first half of 2023, so we should keep our expectations muted for now.
Real Estate: The Weakest of the Bunch
Of all of the sectors we follow, real estate is currently the weakest. The sector was positive for the month of November, but just barely, lagging behind most risk assets. You can see below it is still in its down trend pattern and struggling to get above the lows from June earlier this year. Real estate prices and borrowing costs are still high when compared to just a few years prior. For now, we must wait and see a trend change before real estate is investable.
Commodities: Hanging On By a Thread
Commodities did not rally with risk assets in November, posting a small loss for the month. With peak inflation likely behind us at this time, commodities seem to be having a hard time catching a bid higher. Global demand, especially for oil, is now becoming a worrisome factor for the global economy going forward. If demand is slowing, as the price is suggesting, then future economic output will likely suffer. You can see below, commodities are still barely hanging inside the blue box. Falling out of the blue box lower would be the final confirmation of the commodities bull run ending.
One commodity that has been perking up as of late is gold. Although perceived to be tied to inflation, gold is more closely anchored to interest rates. You can see below how gold has traded against interest rates (grey). Gold peaked when rates bottomed in mid 2020. Now it appears a bottom in gold has been found with a peak in interest rates. We’ll continue to monitor this relationship to see if gold might be a position to hold into a global demand slowdown.
Fixed Income: Long-Term Rates Falling
While short-term interest rates continue to push high from Federal Reserve policy, longer-term rates from 10 to 30 years out are starting to roll over. Below is a snapshot of the 10-year U.S. Treasury yield. You can see that it has started falling through and below the upward trend line that has been support throughout 2022.
This is significant as longer-term interest rates tend to reflect inflation and growth expectations. Falling long-term rates reflect low inflation and growth expectations. With peak inflation in our rear view mirror, this indicates the bond market is starting to see lower economic output in the future. When you put these falling long-term rates in the context of the yield curve, we see it is the most inverted it has been in about 40 years – and by far the most inverted we’ve seen in the 2000s.
This development is not a very positive one for the global economy, but it may offer investors an opportunity to benefit from owning long-term bonds.
All Terrain Portfolio Update
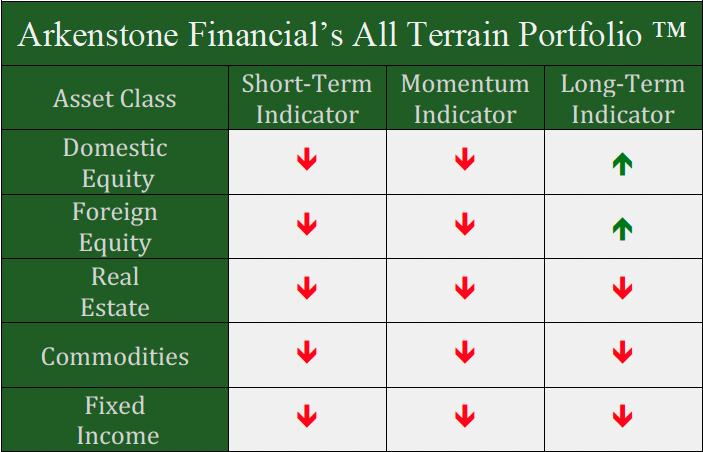
Our signals and indicators have pushed us into small positions in defensive stocks. We continue to hold the U.S. dollar as well. The vast majority of the model remains in risk averse, short term treasuries and notes that are paying interest in the 3.5 to 5% range. Our data and outlook continue to be weak for 2023, so we will remain risk averse and agile until the data improves. We will continue to wait for investment opportunities, and in the meantime, follow our indicators and process to adjust risk as new data is presented.

Past performance is not indicative of future results. Other asset classes or investment vehicles may be used in client portfolios and client portfolios may not hold all positions of the model at the same time as the model. This chart and its representations are only for use in correlation to the proprietary timing model by Arkenstone Financial, Registered Investment Advisor. Actual client and All Terrain Portfolio(TM) positions may differ from this representation.
- Rising Rates Create Headwinds - November 8, 2024
- The Fed Finally Cuts Rates - October 10, 2024
- Interest Rates Stabilize, Stocks Bounce - September 6, 2024


Leave a Reply