In a Nutshell: Risk assets bounced nicely last month while longer-term interest rates started falling for the first time in over a year.
Domestic Equity: The Bottom or Bear Market Rally?
The S&P 500 has rallied nearly 14% from the lows in June this year. A fierce rally to be sure, especially considering we just printed back-to-back quarters of negative GDP in the first and second quarters of this year. This rally puts us in another interesting spot, nearly identical to the situation that played out in April 2022 at the 4600 level. Just like April, we are currently coming off of a big rally into an important level (this time 4200) for the second time. We even have a slight break in the down channel just like April. We wouldn’t expect it play out exactly like it did in April, especially as we enter August, one of the least eventful months of the year for the stock market. However, our current and forward looking economic backdrop is still weak, so preparing for more downside in stocks makes sense.
The rally of the last 45 days has done a lot to improve market structure and short-term breadth and participation. However, stocks in aggregate are still making more lows than highs as shown in the chart below. The middle blue line represents the break even level. You can see that periods that predominantly stayed below the middle line, like now and 2015-2016, corresponded with poor stock performance until we started seeing more highs than lows.
If we were going to see the market rally for the long term, we’d like to see improvement in the most beaten down sectors of the market. Technology, the darling sector of 2020, has been in a down trend for longer than any other sector. Software, shown below, was down over 40% at one point, heading all the way down to the pre-pandemic highs of 2020. While it is nice to see support holding and this sector building a base, a breakout is not confirmed – but the sector is in the initial stages of moving toward one.
The Federal Reserve raised rates another 0.75% in July. Bond markets are now expecting at least another 0.5% in September, the next Fed meeting. Interestingly, there is a narrative that inflation has peaked and the Fed has pivoted to a more supportive policy stance. At this point in time, we have no evidence to support that narrative. The Fed will likely be explicit in words and actions when they have pivoted, and we’ve yet to see that. Since the Fed continues to aggressively fight inflation while stating they think the economy is still in good shape, there is great risk in assuming they will switch their stance before they actually do.
Global Equity: No Relief in Sight
Despite the strong rally in U.S. equities, global equities could barely get off the mat. You can see below the accelerated downtrend of 2022 is still intact, and for good reason. The economic outlook globally is quite bleak over the coming six to 12 months, creating the possibility of a global recession.
One of the reasons emerging markets struggled so much is that the largest component, China, had a nasty sell off last month right at the make or break mark we highlighted previously. This is a very discouraging development for the global economy since China is such a vital part. Fundamentally, China has one of the best economic paths forward in the world, so we’d hope to see price recover.
Real Estate: Nice Bounce, Need More
Real estate has had a really nice rise from the June lows. The combination of falling interest rates and a renewal in risk appetite by investors sent real estate on a 15% rally. Much like U.S. stocks, the rally has taken real estate to a decision point. Heading higher through this resistance level (blue line) would be very encouraging. Given our economic backdrop, we’d anticipate failure to overcome this resistance level, leading to real estate trading lower. Until we have resolution one way or the other, we will be in wait and see mode with real estate.
Commodities: Support Held, for Now
Commodities in general have been selling off pretty hard over the past few months, marking a significant tone shift for this asset class. Below, you can see the big reversal. The sector did catch and hold the swing low prior to the Russian incursion that sent prices higher, eventually catching a nice 10% bounce. What happens next will be important. A reversal back and through the blue support level in the chart may be the final nail in the coffin for this two-year long commodities bull run.
Oil is by far the strongest component in the commodities complex, as well as one of the most important from a global macro standpoint. You can see the chart similarities to the entire basket of commodities above. The swing low from post-incursion has held, but oil is down over 20% in the last two months. Additionally, some bearish foreshadowing could be building as price has spent a lot more time near the lower end of the most recent range than the top. Oil breaking lower from here would be good for inflation, but bad for future economic growth. Oil is one of the more important assets to watch in the coming months.
Fixed Income: The Yield Curve Inversion Is Serious Now
Previously, when the yield curve approached inversion in April, we detailed what yield curve inversion is and how it had occurred prior to every recession over the last 50 years. Yield curves invert when future growth looks bad, so rates further out in time fall below rates closer to the present. Below we have the yield curve plotted along the S&P 500. The yield curve is in green and when it falls below the blue line, inversion occurs. Black is the S&P 500. The blue boxes highlight periods in time where the yield curve has inverted and the stock market peaked. You can see we are now more inverted than we have been in the last two decades and are approaching the 2000 recession levels. You’ll also see all of the blue boxes precede recessions and stock market crashes of at least 35%.
When we discussed the inversion from earlier this year, we identified the difference with the 2022 inversion against prior inversions. The big difference was that interest rates of all maturities were increasing, and the shorter term rates were rising faster. While this was concerning, we didn’t have long end rates falling, just rising slower. That has now changed and put us into more concerning and much more typical pre-recessionary interest rate behavior. We now have longer term interest rate falling. The 10-year U.S. Treasury interest rate is below, slipping below a major support level, trending lower.
Here’s the 30-year U.S. Treasury interest rate below. A similar path as the 10 year.
This shift to a down trend in long term rates seems to reflect the bond markets’ higher concern of falling economic growth versus rising inflation. This development certainly has our attention, and we’ll monitor it closely.
All Terrain Portfolio Update
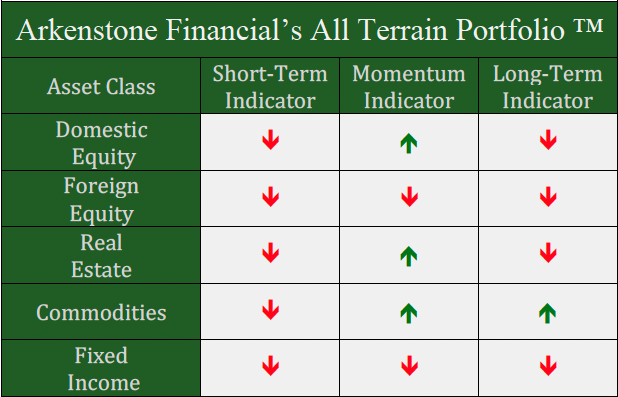
Our signals and indicators continued to rotate out of risk assets, as we now carry over 89% cash in the All Terrain Portfolio. Despite the wide ranging potential investment exposures allowed by our model, there are very few investment options that fit our criteria currently. We will continue to wait for investment opportunities, and in the meantime, follow our indicators and process to adjust risk as new data is presented.

Past performance is not indicative of future results. Other asset classes or investment vehicles may be used in client portfolios and client portfolios may not hold all positions of the model at the same time as the model. This chart and its representations are only for use in correlation to the proprietary timing model by Arkenstone Financial, Registered Investment Advisor. Actual client and All Terrain Portfolio(TM) positions may differ from this representation.
- U.S. Stocks Make New Highs - December 6, 2024
- Rising Rates Create Headwinds - November 8, 2024
- The Fed Finally Cuts Rates - October 10, 2024


Leave a Reply