In a Nutshell: Equity markets rebound off the year’s lows, while interest rates continue to rip higher.
Domestic Equity: The Bottom or Bear Market Bounce?
The S&P500 had a voracious rally to close out the first quarter after finding its footing mid-March. This rally brought the popular index back within 5% of its all-time high, after being down over 12% earlier in the month. Rallies of this strength and size typically occur within a large down trend or at the end of a big down trend, so the market has at the very least created some additional confusion after breaking the down trend highlighted by the channel below. However, the index broke through and failed to hold a key level around 4600 for the third time in the last two months, so this market has some appeal to both the bears and the bulls right now. The challenge going forward for the U.S. stock market is second quarter economic data and corporate profits. The data from the second quarter of last year was so strong and fueled by stimulus money flowing through the economy, that when comparing this year’s data to last year’s, the data will likely show a significant deceleration of growth for the first time since early 2020. With that in mind, risk in U.S. equity markets will be elevated for the next few months.
Although the broad market held up relatively well, more specialized markets like technology (down 12%) and small cap companies (down 15%) show a much less optimistic price chart. Below the Russell 2000 (small caps) chart shows a clear rejection at a key level off of the big mid-March rally. Any sustained failure to recapture this key level favors more downside.
One very bright spot through the first quarter of the year was the utilities sector, one of two core sectors to post a positive start to the year. In fact this sector has maintained its uptrend since the Covid low in March of 2020. This is a defensive equity position, so to see it leading is not exactly encouraging for the broader market.
The Federal Reserve made their first interest rate increase since 2018 this past month in a widely-anticipated move. Although equity markets rallied after the rate hike, the Fed was fairly clear that they are prioritizing bringing inflation down, even at the expense of the economy. The bond market is now pricing in 8 total 0.25% interest rate hikes by year end. We will find out how strong and resilient the economy is as we approach a period of decelerating growth, while the Federal Reserve is doing their part to cool off the economy through higher rates.
Global Equity: Still in Trouble
Global equity mirrored U.S. stocks by bottoming in mid March, followed by a swift rally to close out the first quarter. Both developed and emerging market stocks are looking very much like a bear market bounce – another way of saying the rally, although fierce, did nothing to buck the down trend. Both have rallied hard but still were unable to print above the already trending down resistance levels as described by the blue channels below. Europe makes up a good portion of the developed market index and China and India make up a good chunk of the emerging markets index. All of these countries have been hit hard by the supply and resource issues exacerbated by the Ukrainian conflict. Global stocks are looking like they are a long way away from being investable.
Real Estate: Surprising Strength
We mentioned last month that real estate held up okay while stocks sold off in February. Unlike stocks, real estate did not make a new low in March and ended up rallying and closing the quarter above a key resistance level. The surprise in this move was that interest rates went much higher during the march time frame, hitting a 5-year high for the average 30-year mortgage rate. A rise in interest rates should make real estate more costly to service or purchase, yet the real estate index still moved higher. If this type of relative strength can be sustained it would be a welcome pocket of strength among a sea of weakness in risk assets.
Commodities: Commodities, Gold Stay Strong
The broad basket of commodities we track rose again in March, albeit with increasing volatility. Led by oil and food prices as a result of supply chain issues in Russia and China, commodities rose higher. With the Ukrainian conflict seemingly having no quick resolution in sight, and China now locking down their major cities again due to Covid scares, we should expect to see wild swings in commodities prices depending on the news cycle. This dynamic will make inflation difficult to predict in the short term. We are entering a period of economic data where it will be harder for inflation to rise on a year over year basis. So if we see inflation rising over the next few months, we’ll know the inflationary pressures are still extremely strong.
Gold briefly touched the 2020 all-time high value last month, but quickly retreated. The 1900 level was held, leading us to believe there is more fuel behind this move. With real global economic growth likely falling, gold should get a boost fundamentally. From a demand perspective, gold could get a boost as well. Periods with weaker global currencies experiencing large volatile moves can generate demand for gold by Central Banks, like we are currently seeing in Russia.
Fixed Income: A Flat and Inverted Yield Curve
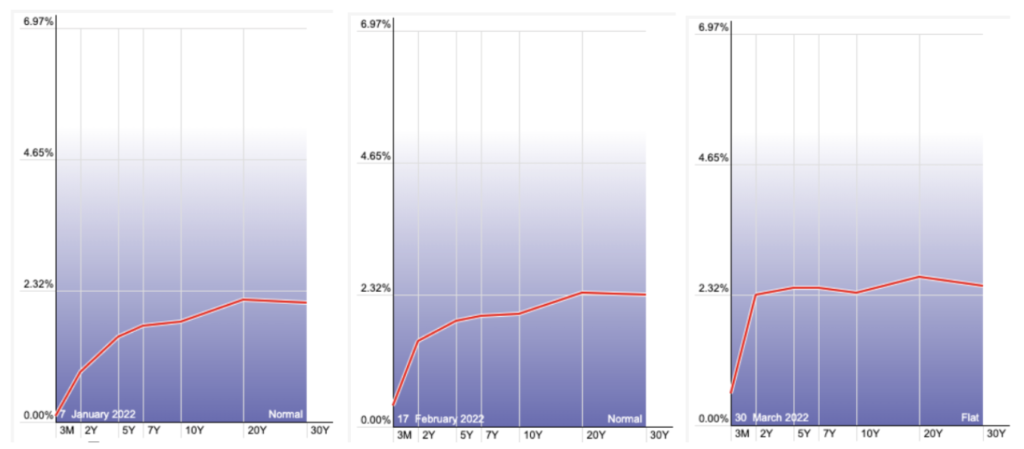
A recent hot topic in the fixed income world is yield curve inversion. Typically, interest rates are higher the further they are from their maturity date, as investors are looking for more yield the longer they will have to hold the bond. The term yield curve inversion is used to describe when the yield curve becomes so flat across time intervals that the parts of the curve that are further out show yields lower than the parts of the curve that are on a shorter time frame. Recently, the 30-year U.S. treasury yield dipped below the 5-year, and as shown below we briefly saw the 10-year dip below the 2-year.
Why is this a big deal? Well every recession over the last 50 years was preceded by a yield curve that has inverted. The problem with this indicator is it is effectively worthless from a timing perspective. The average time between inversion and recession is 18 months. For example, the yield curve inverted in 2005 but the housing market crash didn’t begin until late 2007. But the yield curve inverted just months before the Covid crash in 2020. What this boils down to is that even in periods of bad economic data, markets still need a catalyst to start selling.
Yield curves tend to invert because growth expectations fall and the long end of the curve (which is the most sensitive to growth expectations) begins to fall, and eventually falls far enough to go drop below parts of the curve that are much closer in time. The context we have this time around is that interest rates across the yield curve are all moving higher at the same time, as seen by the 10-year interest rate below.
However, the short end of the curve is rising much faster than the long end because of the expectations that the Federal Reserve will be raising rates a lot in 2022 to fight inflation. You can see below that the 2-year interest rate has spiked by a multiple of three over the last three months.

So what do we do with this information? For now, it is just another data point to consider. While we do anticipate economic growth to fall in the second quarter of 2022, that doesn’t have to mean recession. If rates at the long end of the curve start falling and the yield curve is still inverted, that would be a bit more concerning, especially coupled with falling economic growth. We’ll continue to monitor the fixed income space for more clues on the direction of our economic growth and inflation.
All Terrain Portfolio Update
Our indicators and models informed us to only make small tweaks to our already very defensive positioning in the All Terrain Portfolio. Our positioning has allowed us to produce modest gains again in March while reducing volatility and risk significantly. We will continue to follow our indicators and process to adjust risk as new data is presented.
Past performance is not indicative of future results. Other asset classes or investment vehicles may be used in client portfolios and client portfolios may not hold all positions of the model at the same time as the model. This chart and its representations are only for use in correlation to the proprietary timing model by Arkenstone Financial, Registered Investment Advisor. Actual client and All Terrain Portfolio(TM) positions may differ from this representation.
- Rising Rates Create Headwinds - November 8, 2024
- The Fed Finally Cuts Rates - October 10, 2024
- Interest Rates Stabilize, Stocks Bounce - September 6, 2024


Leave a Reply