In a Nutshell: Risk assets across the globe suffered massive damage below the surface on a rare Thanksgiving holiday market dip. Interest rates and commodities pivoted flat to neutral.
Domestic Equity: The Stealth Bear Market in Technology
The stock market fell just 4% from its peak in November, but it was unique in the fact that it was one of the most destructive 4% corrections (under the surface) we’ve ever seen and it happened during one of the historically strongest months of the year. Additionally, the price action by sector style didn’t seem to fit any of the inflation or Omicron narratives. Below is a composite picture of the difference between the number of stocks making new highs against stocks making new lows. You can see below that since the pandemic low in 2020, we stayed in positive territory, which should make sense given the broad stock market uptrend we’ve seen since then. We saw bumps along the way, but always stayed near zero on the pullbacks. This time around was much different, as we reached -4000, meaning there were 4000 more companies hitting lows versus highs. This type of market action is traditionally a sign of 15% or more broad market corrections (2015-16, 2018, and 2020). Not this time around.
This diversion is even more distinct in the technology-laden Nasdaq composite index. Below, we are tracking the number of stocks in an uptrend. This shows that about 75% of all Nasdaq stocks are trading in a down trend, which typically only happens in broader bear markets. The Nasdaq index is up on the year so the index is not in a bear market. However, the average Nasdaq stock is -30% on the year, meaning most stocks in the index are in a bear market.
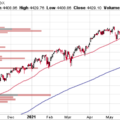
How could this happen if the Nasdaq index (below) is up 20% on the year? The Nasdaq, like most indices, is market cap weighted. Meaning the larger the company, the more influence on performance return to the index. The Mega-Cap tech stocks like Apple and Google are more than 25% of the index and have had great years, pushing the index higher. Meanwhile the small and mid cap stocks have had largely negative returns, but are more than offset by the large company positive returns. These large divergences often mean revert, so the smaller companies could be set to rebound. And with accelerating economic data in the fourth quarter of this year and into early 2022, the Santa rally could be back on the table.
The Federal Reserve announced they would start reducing some of their emergency stimulus to the economy, albeit slowly and with advance warning. They also communicated a willingness to raise short term rates up from zero, but that decision will be data dependent based on supply chain issues and inflation. In a recent press conference the Fed chair, Jerome Powell, implied that inflation is no longer temporary, but here to stay. The timing is curious as a lot of our macro indicators are suggesting the contrary. Time will tell, and regardless of the headlines, we’ll follow the data.
Global Equity: Are We There Yet?
Most of the global stock markets outside of the U.S. have been bad this year. Below we can see emerging markets and developed stock markets are either flat or down on the year. However, most of those broad indices are disproportionately linked to China. China’s economic data is now starting to turn to the upside for the first time all year. So although these markets have been poor investments this year, the biggest catalyst to global markets is starting to rebound. Patience is key, but an upside breakout of the channels below should be meaningful.
Real Estate: To the Brink and Back
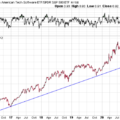
Last month we mentioned the relative weakness of the real estate sector and how its year-long trendline was in jeopardy of breaking. Real estate could not escape the brief contagion in the equity markets last month and we can see that while it does appear the trendline broke, it did so only temporarily. This sell off was likely the recharge needed to take the sector higher and make all time highs after failing to do so in November. With interest rates falling and economic growth accelerating into year end, real estate could be up for a strong finish to the year.
Commodities: Breaking Trend
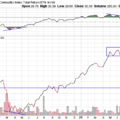
The trend for commodities since the pandemic started back in 2020 was definitely up. The price patterns we saw were a rinse and repeat of prices going up, followed by some form of consolidation, then up some more. Price action in November broke both the trend and the pattern. This massive price breakdown was led by oil, which was down nearly 20% in the month, dragging commodities down along with it. It is very possible this price action was a result of the violent sell off we had into month end, or it is an initial sign that inflation is peaking.
Checking in on our old friend, gold, we see that it was dead money in 2021. This is worth calling out as 1) it is currently in a massive consolidation and could move either up or down, but likely quickly if it does break this range and 2) although gold is perceived to be a good hedge against inflation, it was not in 2021. Inflation more than doubled, but gold depreciated in value during the year.
Fixed Income: What Does the Bond Market Know About Inflation?
Over the past few months we’ve seen the yield curve flatten, meaning shorter term interest rates have been increasing while longer term rates have been falling. You can see this action below. Short term rates (green) are primarily influenced by Federal Reserve policy. The Fed has indicated they will raise interest rates, and short term rates have since increased. However, longer term rates (red/black) are influenced by future inflation and economic growth expectations. Below we can see long term rates ran higher earlier in the year because of the perception of both inflation and growth increasing. Looking back in time, the bond market was right about both since we got lots of economic growth and inflation this year. The back half of this year has seen long rates fall with another leg down in the fourth quarter. While economic growth did slow in the 3rd quarter this year, it is reaccelerating into 2022. So it appears the bond market is telling us inflation has peaked. Couple this with commodities seeing their weakest price action this year and a compelling case can be made that the highest inflation is behind us. Inflation data shows up on a one month lag, so it won’t be until early 2022 before we can say whether the bond market got it right or not.
All Terrain Portfolio Update
We followed our indicators and models in the All Terrain Portfolio and were forced out of some risk positions and added to others. The net result was a slight reduction in risk for the final month of the year. We will continue to follow our indicators and process to adjust risk as new data is presented.
Past performance is not indicative of future results. Other asset classes or investment vehicles may be used in client portfolios and client portfolios may not hold all positions of the model at the same time as the model. This chart and its representations are only for use in correlation to the proprietary timing model by Arkenstone Financial, Registered Investment Advisor. Actual client and All Terrain Portfolio(TM) positions may differ from this representation.
- U.S. Stocks Make New Highs - December 6, 2024
- Rising Rates Create Headwinds - November 8, 2024
- The Fed Finally Cuts Rates - October 10, 2024


Leave a Reply