In a Nutshell: U.S. stocks rallied off of the lows of early October as investors seized this buying opportunity and interest rates continued their trend higher.
Domestic Equity: The Dip Was Bought
The big question for markets as the calendar changed to October was would investors buy the 5% correction. The answer was a resounding “yes.” The NASDAQ is perhaps the best example of that. Below you can see the circled area we called out as a good buying opportunity last month. Investors agreed, as the index has run up about 14% from that early October low.
Small cap stocks had been the laggard this year of all the major stock indices. Not only was the dip bought in small caps, they broke out of a 9-month long consolidation. This is a great sign for not only small cap stocks, but stocks in general.
The breakout in small caps benefits all stocks because it resolved the deteriorating breadth concerns some investors had. Below you can see how the third quarter of this year created a rising stock index (bottom chart) with no additional companies participating in the uptrend (top chart). This type of disconnect in participation can lead to pullbacks, like we saw. You can also see that in October we set a new high in uptrending stocks with new highs in the stock market, a very healthy combination. Although stocks look pretty extended with the big rally off of the recent lows, it will be hard to bet against stocks in November, which is traditionally one of the best months for U.S. stocks.
The Federal Reserve announced they would start reducing some of their emergency stimulus to the economy, albeit slowly. They also communicated a willingness to raise short term rates up from zero, but will be data dependent based on supply chain issues and inflation. The rates and stock markets seem to already have priced in the news as stocks kept going higher and short end rates are already priced for two rate hikes.
Global Equity: Global Stocks Not Joining the Party Yet
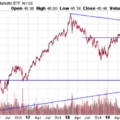
We previously mentioned how emerging market stocks have been in downtrend for months. Zooming out even further and looking at all stock markets outside of the U.S., you see a flat market for most of this year.
The longer term trend for global stocks is up, so a break above the top blue line would be a great sign for all stock markets.
Real Estate: The Line Was Held
Last month we called out that real estate would need to hold the diagonal line below to keep the current trend intact. The line was held, and real estate rebounded nicely. The one complaint about this rebound is that it was relatively weaker when compared to the stock market. Meaning real estate is still battling to make new all-time highs while most major stock indices have already done so. It appears the previous high value might not get taken out on the first try so perhaps a pullback down to the diagonal trend line will be needed for real estate to move through the (horizontal) resistance line. The trend is still up, but momentum is fading with a key level holding this sector down. Said another way, real estate has work to do to keep up with stocks into the year end.
Commodities: Taking a Breather
Commodities broke out of a consolidation in September, and as has been the pattern over the last two years, spent October consolidating after the breakout. The trend is up until proven otherwise, so patience through this current consolidation may be needed. However, with supply chain issues still far from being resolved and consumer demand still very strong, the pressure needed to push prices higher is still built into our global economy.
Fixed Income: Rates Look to Hold Trend
We previously highlighted how rates rising as stocks fell presented a good indication that we could see economic growth reaccelerate into year end and that could be a good buying opportunity for stocks. The bond market, once again, looks correct. However, for this idea to hold through the end of the year, interest rates will need to hold this level and head higher. You can see on the chart below that rates are on the brink of losing what looks like new support. This will be an important chart to watch as stocks try to rally into year end.
We are now seeing the front end (shorter duration) of the yield curve rise. These moves tend to be less about economic implications and more about the Federal Reserve policy – since they control the most short term rates. The bond market always seems to know what is coming in advance. The two-year interest rate doubled over the two months prior to the Fed announcing they intend to raise rates twice in 2022.
All Terrain Portfolio Update
The All Terrain Portfolio has rotated out of defensive positions and into more cyclically sensitive and growth-oriented sectors on last month’s sell off. We added more risk into November. We will continue to add risk as long as projected future economic data continues to improve. We will follow our methodology and indicators to find buying opportunities and manage risk.
Past performance is not indicative of future results. Other asset classes or investment vehicles may be used in client portfolios and client portfolios may not hold all positions of the model at the same time as the model. This chart and its representations are only for use in correlation to the proprietary timing model by Arkenstone Financial, Registered Investment Advisor. Actual client and All Terrain Portfolio(TM) positions may differ from this representation.
- U.S. Stocks Make New Highs - December 6, 2024
- Rising Rates Create Headwinds - November 8, 2024
- The Fed Finally Cuts Rates - October 10, 2024


Leave a Reply