In a Nutshell: Another small equity pullback was gobbled up by investors. Interest rates continue to fall along with China’s stock market.
Domestic Equity: All Dips Have Been Bought
U.S. stocks haven’t had a 5% pullback in nearly a year, which is remarkable as an average year will see about three pullbacks of that size. Below you can see insatiable dip-buying by market participants, where the red line (10-week average price) has only been breached momentarily in 2021. This appetite for equity exposure is the result of good economic data we’ve been seeing on the year so far. However, with economic data now coming in a bit more mixed, and as we enter the most seasonally weak time of the year for U.S. stocks, this dip-buying behavior may be put to the test.
Last month we mentioned a potential sea change in investor positioning within equity markets. This change seems to be suggesting investor preference for technology and defensive positions as opposed to the economically sensitive investments that have done so well this year. Another way of visualizing this shift is in the chart below. Below we have a ratio chart of the Dow Jones Industrial Average against the Nasdaq Composite. This is a general comparison of cyclically sensitive vs. technology stocks. When the chart moves up and to the right, the Dow Jones leads. You can see the long-term trend favors technology and that trend was accelerated by Covid. The Dow has led since last November, but the Nasdaq has seemingly taken the reins back this past month.
The Federal Reserve continues to remain accommodating with emergency-level treasury bill purchases, or quantitative easing. The Fed has hinted at a willingness to reduce this purchasing and has also indicated that it may raise interest rates near the end of 2022, which is sooner than the previous target of 2023. The Fed is not worried about inflation, but has acknowledged that inflation is higher than expected.
Global Equity: Emerging Markets Finally Break
We previously highlighted how emerging markets (EMs) were stuck in a trading range as highlighted below. That range finally broke to the downside, suggesting more weakness is to come.
That breakdown was led by China. China’s economic data trends are currently perhaps the worst in the world and China’s outsized influence on EMs has dragged the entire index down. Chinese stocks are now down over 20% from their high water marks. From an economic data perspective and price chart, there is lots of work to be done to get back into an uptrend.
Real Estate: Still a Market Leader
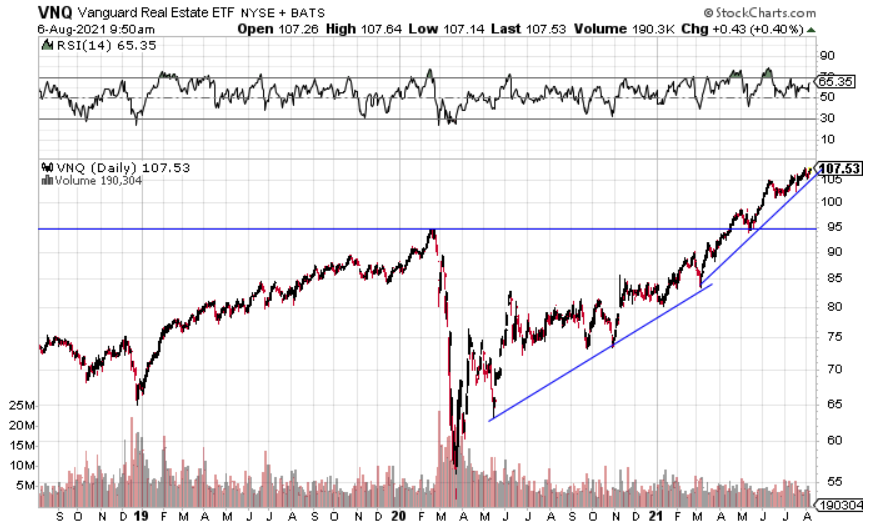
Real estate continues to lead the market higher, as its strong trend remains intact. Although we are seeing some signs of exhaustion in this market, price is the ultimate guide. With the twin tail winds of bond yields falling with economic data cooling, real estate could be a preference for those seeking yield or price appreciation.

Commodities: Commodities Still Stuck, Gold on the Rise
Commodities continue to be stuck at our $27 price target. The longer price lingers in this area, the more likely the next move (up or down) will be quick. The trend has been up, so we’ll lean towards an upside resolution until proven otherwise.
Gold has popped back up on our radar after living in a downtrend for the past year. Economic conditions have now shifted to a more supportive backdrop. Gold tends to trade inversely to real interest rates. With inflation rising or at least staying higher than normal with nominal interest rates falling, real rates could fall further, giving gold a boost. From a technical perspective, gold is back in its support zone and could be primed for a move higher.
Fixed Income: Interest Rates Continue to Fall
Interest rates continue to fall while inflation stays high. What this means for investors is that when they factor in inflation they are taking a loss from holding fixed income investments. Not exactly incentive to hold bonds, but perhaps an incentive for holding equities. However, the relationship between inflation and rates could be shifting. Below is our chart of inflation protected bonds versus regular bonds. With the chart moving up and to the right, that indicates inflation protected bonds are leading, likely because inflation is rising. This trend has been solid for over a year now, but we can see some signs of exhaustion or even possibly a reversal. We are seeing momentum falling with price increasing, which can lead to a reversal in price, or in our case a reversal from inflation leading. Some of our data suggests inflation is peaking, but rates remain bearish, so this will be a very interesting relationship to follow for equity and bond investors alike.
All Terrain Portfolio Update
The All Terrain Portfolio continues to rotate risk into the strongest performing assets within broader sectors. With many economic forces approaching a potential turning point, we have continued taking a more defensive posture. We will continue to follow our methodology and indicators to find buying opportunities and manage risk.
Past performance is not indicative of future results. Other asset classes or investment vehicles may be used in client portfolios and client portfolios may not hold all positions of the model at the same time as the model. This chart and its representations are only for use in correlation to the proprietary timing model by Arkenstone Financial, Registered Investment Advisor. Actual client and All Terrain Portfolio(TM) positions may differ from this representation.
- U.S. Stocks Make New Highs - December 6, 2024
- Rising Rates Create Headwinds - November 8, 2024
- The Fed Finally Cuts Rates - October 10, 2024


Leave a Reply