In a Nutshell: Bond yields plummet, while technology stocks take back the reins. Economic transition may be upon us as many asset classes pivot from strong to mixed signals.
Domestic Equity: Regime Change Coming?
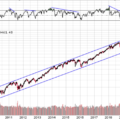
As we’ve noted previously, reflationary or cyclical sectors have dominated the first half of 2021. Left-for-dead sectors like energy have dominated the beloved technology stocks this year – a complete reversal of last year. With economic reopening underway along with very easy year over year comparisons, the U.S. economy has posted some of the best economic and highest inflation data in decades. Cyclically sensitive stocks have benefited and technology has lagged for the better part of the last nine months. However, that trend may be reversing again. What we see below is the relationship between software and the stock market. With the chart moving up and to the right, that means software has greatly outpaced all other stocks for the last five years. The relative underperformance of software stopped at the long term trend has since gone on a tear, becoming the market leader for the past two months, by a long shot. This investor preference back to technology suggests that economic and inflationary data may be peaking. If the economy does pivot to slowing growth, that will likely set the theme for the back half of the year, and technology should be the benefactor.
Another way of visualizing this slowing of the economy can be seen below. The top chart is the S&P 500 index and the bottom charts are the percentages of stocks in uptrends with respect to the last 20, 50, and 200 days. You can see the index keeps rising while participation is declining. This is a potential warning sign for investors, but not a red flag in and of itself. This type of behavior can happen before pullbacks, but also can be a natural occurrence during underlying market rotation as we’ve seen over the past two years. Additionally, if large cap technology stocks like Microsoft, Apple and Amazon start leading the market, their sheer size can hold the market up even with less stocks participating in the uptrend.
The Federal Reserve continues to remain accommodating with emergency-level treasury bill purchases, or quantitative easing. The Fed has given indication that it may raise interest rates near the end of 2022, which is sooner than the previous target of 2023. This was on the heels of an acknowledgement that inflation is going to run hotter for longer than they initially projected.
Global Equity: Emerging Markets Look Stuck
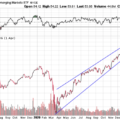
Emerging markets (EMs) have been stuck in a 7% range for the entire year, aside from a brief failed breakout in February. EMs are heavily represented by Asian countries, and they were broadly, the fastest out of the proverbial pandemic gate. With Asian economic data slowing you can see that illustrated by the flat price action below. An enormous amount of volume has built up in that mere four point range meaning, if that range breaks either way, it will likely have the fuel to run for a while. A reduced level of exposure to EMs makes sense until we see resolution on the chart.
Real Estate: Tailwinds Starting to Pick Up
Real estate had a weak month when compared to the broader stock market, but still continues to lead the market into the back half of 2021. When comparing real estate to the stock market as our chart below does, you can see sentiment change from laggard in 2020 to leader in 2021. It’s very possible this trend stays intact as bond yields fall and economic growth slows. That scenario would likely have those seeking either yield or growth exiting bonds and weaker stock sectors and moving into real estate. Rent forbearance is also set to expire later this year, which may help residential and commercial real estate owners two fold by allowing them to exit tenants who are not paying rent and also raising rent to levels more appropriate to home and building level values.
Commodities: Is Supply Meeting Up With Demand?
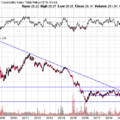
We’ve enjoyed a nice run in commodities over the last year, but are now starting to see concerning developments. Over the past few months we’ve seen hard and soft good prices, like lumber and corn, come back down to earth as inflation is slowing its rate of growth. Our price chart below supports the fundamental concerns. Our $27 price target was hit, but has now failed to hold it three times with falling momentum – a common recipe for a pullback. Furthermore, although we see inflation staying higher than we are used to, future inflation looks likely to come from rent increases and not goods inflation. We’ll continue to follow the data, but we’ve started taking profits and reducing the size of this position in our model.
Fixed Income: Yields Collapse
Last month we questioned what the bond market was pricing in with inflation hitting 20-year highs. Mid-to-long-term bond yields are primarily influenced by expected inflation and expected growth. With a 18% decline in the 10 year U.S. Treasury yield last month, it seems the bond market is not very optimistic about either rising growth or inflation. That outlook does overlap with the anticipated slowing economic data we are seeing. The challenge for investors going forward will be determining what value the traditional bond allocation provides to their portfolios. A yield of 1.3% is well below inflation, so purchasing power is lost through holding bonds. And with yields so low, how much protection can they provide if stocks sell off? An interesting dynamic that may influence portfolio positioning by investors for years to come.
All Terrain Portfolio Update
The All Terrain Portfolio continues to rotate risk into the strongest performing assets within broader sectors. With many economic forces approaching a potential turning point, we have started taking a more defensive posture. We will continue to follow our methodology and indicators to find buying opportunities and manage risk.
Past performance is not indicative of future results. Other asset classes or investment vehicles may be used in client portfolios and client portfolios may not hold all positions of the model at the same time as the model. This chart and its representations are only for use in correlation to the proprietary timing model by Arkenstone Financial, Registered Investment Advisor. Actual client and All Terrain Portfolio(TM) positions may differ from this representation.
- U.S. Stocks Make New Highs - December 6, 2024
- Rising Rates Create Headwinds - November 8, 2024
- The Fed Finally Cuts Rates - October 10, 2024


Leave a Reply