In a Nutshell: Commodities continue to skyrocket on inflation concerns, while rates take a breather and provide fuel to U.S. equity growth.
Domestic Equity: Not All Indices Enjoyed April
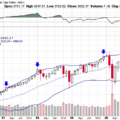
April is one of the most seasonally bullish months of the year for the S&P 500 index. 2021 was no exception as the index added an impressive 5% over the month. Below, we see the index has tagged the upper blue line which indicates a two standard deviation move from the longer-term trend. This extreme positioning is a result of a big move up, but the by-product is the risk/reward tradeoff from buying at these levels isn’t very attractive. Investors would want to see a brief pullback before resuming higher.
However, as shown below, market breadth and participation was lacking in April as both the Nasdaq (technology) and the Russell 2000 (smaller companies) lagged and failed to make new highs. In order for markets to charge higher, these indices will need to participate.
The Federal Reserve continues to remain accommodative with emergency-level treasury bill purchases, or quantitative easing. The Fed has stated that any rise in inflation (as measured by CPI) will be short lived and interest rates will remain low through 2023.
Global Equity: Losing Strength
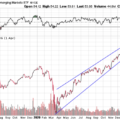
Emerging markets (EMs) broke out of their consolidation and were positive for the month, but were grossly outperformed by U.S. stocks. This relative underperformance is one of the few economic red flags we are currently seeing across the globe.
China is the largest component of the EM complex and the second largest global economy but it is now in a falling growth phase. This makes China the first major country across the globe to exhibit such signs post COVID-19. The chart below shows the Chinese stock index is well off the highs and has some work to do to hold support and prevent further downside. With China as the first country out of the post-pandemic gates, they will likely be a leading indicator for the rest of the globe.
Real Estate: Fresh All Time Highs
Better late than never, especially for all-time highs in the real estate sector. While many other major investment sectors were leading and making new high values, real estate slowly and steadily chugged along, trailing equities last year. The chart below shows how real estate has been in overdrive over the past two months, tacking on 16% in that time frame. The recent pace is clearly unsustainable, and by just about every metric we follow, this sector is due for a breather. However, if real estate falls back to and holds the previous all-time high around the 95 level, that would be very constructive, supporting a longer term move higher.
Commodities: Another Huge Move Up
We got what we asked for with commodities, as the pull back in March gave way to a 10% rally in April. Inflation was the theme over the past month as just about all building materials and agricultural commodities rocketed higher. Our data suggests a CPI print at or above 3% is in the cards this quarter which should provide the lift needed to get to the next target around $27.
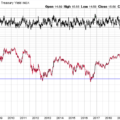
Updating our stocks vs commodities ratio chart, we saw a pullback and rejection at the ascending blue line, right where we’d expect it to happen if the outperformance of commodities over stocks were to continue.
Looking forward in the commodities space, inflation will be the item to watch. The Federal Reserve says our recent bout of inflation is temporary, and our data suggests the same. Inflation, as measured by CPI, looks like it could recede in the back half of the year. However, inflation can be tricky to contain once it gets going, so we’ll continue to keep a close eye on this sector.
Fixed Income: Rising Yields Pause, Likely Go Higher
Interest rates continue to pause and establish a base as they look primed for the next leg higher. Looking at the bellwether 10-year U.S. treasury rate on a short time horizon, we can see 1.75% was the previous recent high at the end of March. After such a big run up, we’d expect a pause at an area that has been a resistance level in the past.
Zooming out we see this 1.75% level was also part of a nearly four decade long channel.
With growth (GDP) and inflation (CPI) – the primary drivers of interest rates – set to increase in the next couple of months, it looks like rates will eventually go higher. Both our short and long term charts suggest that the 2% area would be a reasonable target.
All Terrain Portfolio Update
The All Terrain Portfolio continues to rotate risk into the strongest performing assets within broader sectors. With many indicators looking very stretched coming into May, we have reduced some risk exposure. We will continue to follow our methodology and indicators to find buying opportunities and manage risk.
Chart as of 4/30/21
Past performance is not indicative of future results. Other asset classes or investment vehicles may be used in client portfolios and client portfolios may not hold all positions of the model at the same time as the model. This chart and its representations are only for use in correlation to the proprietary timing model by Arkenstone Financial, Registered Investment Advisor. Actual client and All Terrain Portfolio(TM) positions may differ from this representation.
- U.S. Stocks Make New Highs - December 6, 2024
- Rising Rates Create Headwinds - November 8, 2024
- The Fed Finally Cuts Rates - October 10, 2024


Leave a Reply