In a Nutshell: Stocks rock in August with rates low. Gold takes a breather, while the dollar may be on the cusp of a move higher.
Domestic Equity: Getting Frothy
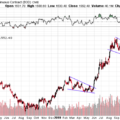
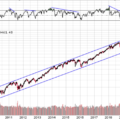
The S&P 500 is now trading at its highest forward looking price to earning multiple since the dotcom bust, but that didn’t stop the S&P 500 from enjoying one of the best Augusts of the last few decades. The tech-heavy Nasdaq followed suit in August as well. Below, we check in the Nasdaq’s “tech bubble” potential we mentioned last month. The Nasdaq has jumped the long term channel below and will likely either return to the confines of the channel or start a new trend at a higher trajectory. A retest and bounce off the top of the range could lead to a new trend, while a break back into the channel could lead to more selling.
Below is another way of highlighting the extreme year we’ve seen in the stock market. The chart shows how the S&P 500 has traded with respect to a two standard deviation range. For the past two years, each time this range has been breached we’ve seen quick moves the opposite direction. We saw this in both directions in the first quarter of 2020. If history repeats itself, we’ll be looking for a pullback in equities in the short to medium term.
The Federal Reserve announced they would allow inflation to go above their target rate of 2% for the foreseeable future and will keep rates low to boost inflation. The Fed’s track record has been pretty bad over the last decade in hitting their inflation target, though they have been very good at keeping interest rates low. The takeaway? Rates will likely remain low, but rising inflation should be believed when seen.
Global Equity: Emerging Markets Denied
Emerging markets (EM) attempted to break out in August, but those efforts were denied on the first attempt. EM may need a pullback to recharge and attempt to break out on a future attempt. The long-term potential in emerging markets is still positive, but the short-to-medium outlook may be more dependent on the U.S. dollar as they tend to trade inversely. The dollar has been fairly beat up as of late, so any kind of strength from the greenback could put pressure on EMs.
Real Estate: Still In Limbo
Real estate continues to recover, albeit slowly. Real estate is still trading below the June high from earlier this year and nearly 15% below the high water mark for 2020 set in February. Although multi-home real estate has held up well this year, all things considered, most other sectors of commercial real estate remain weak. Real estate still has more boxes to check before it’s worth owning.
Commodities: Gold Consolidating, The Dollar Coiling
Gold spent the month of August consolidating after a massive runup in months prior. We previously stated an ideal scenario for a longer-term bull run in gold would include a consolidation while holding the $1900 level. That track has held so far and from our view, we see a symmetrical triangle consolidation that has nearly completed formation. Given the strength of this uptrend over the last few years, this consolidation is likely to resolve with a move higher. A price target of $2200 by the end of the year would not be unreasonable if gold holds its bull trend.
The U.S. dollar has been beaten up over the last few months. The pullback in the dollar has aided strong rallies ranging from U.S. technology stocks, emerging market stocks, to precious metals. The belief is largely that because the Federal Reserve is “printing money” and allowing inflation to rise this will ultimately harm the value of the dollar. In the long run, that may show true. However, in the short-to-medium term, it seems that dollar positioning is a little too lopsided with the majority of market participants betting against the dollar. This type of unanimous sentiment often points to the wrong trade initially. And, according to the chart below, that bet against the dollar may be on the verge of failure. Below, you can see that falling prices with rising momentum (in the top section of the chart) have been going on for the better part of a month now. If price confirms the momentum with a move up, the dollar could put a lot of downward pressure across a variety of asset classes.
Fixed Income: Rates Look Landlocked
The Federal Reserve has been floating the idea of yield curve control through the media recently, but says they don’t want to do it. The chart below suggests they either already are, or market forces are doing it for them. Yield curve control is a way of controlling financial markets by capping interest rates. You can see in our chart that, with the exception of one week in June, the 10-year U.S. treasury yield has been pinned between 0.75% and 0.5%. Until we see evidence that this range is broken, bonds won’t provide much upside or downside.
Inflation has been a hot topic recently as the Federal Reserve announced their intention of allowing inflation to rise above their 2% target – a fairly significant shift for the Fed. However, there is great debate on whether the Fed can actually create inflation or not. In fact, the Fed has never really met their inflation target for the last decade. However, at this point, markets have begun pricing in the expectation of inflation. You can see this below with the ratio of inflation-protected U.S. treasuries (TIPs) against non-inflation linked treasures of the same maturity. TIPs are breaking through resistance and outperforming non-inflation linked bonds for the first time in a few years. Now that markets expect inflation, will we actually see it?
All Terrain Portfolio Update
The All Terrain Portfolio will not add risk this month to its currently limited risk levels due to lofty risk asset valuations and concerns of subsurface dislocations in equity markets. However, we will look to add additional risk assets small in size and narrow in focus as opportunities are presented. We will continue to follow our methodology and indicators to find buying opportunities and manage risk.
Past performance is not indicative of future results. Other asset classes or investment vehicles may be used in client portfolios and client portfolios may not hold all positions of the model at the same time as the model. This chart and its representations are only for use in correlation to the proprietary timing model by Arkenstone Financial, Registered Investment Advisor. Actual client and All Terrain Portfolio(TM) positions may differ from this representation.
- Rising Rates Create Headwinds - November 8, 2024
- The Fed Finally Cuts Rates - October 10, 2024
- Interest Rates Stabilize, Stocks Bounce - September 6, 2024


Leave a Reply