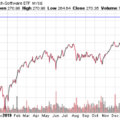
In a Nutshell: Precious metals run wild in July, on the heels of a falling U.S. dollar. As a result, global stocks advance with emerging market stocks outperforming domestic. Interest rates remain historically low.
Domestic Equity: Is Technology Entering Hyperspace?
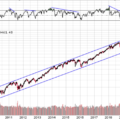
Last month we highlighted the massive run up in technology. Specifically, we called out the Nasdaq composite (index) and how it was at the very top end of a long-term channel. We zoom in below to see that all the Nasdaq has done since then is jump over the long term channel and head higher. If this move to the upside is sustained it would be rare, but not unprecedented, so it is worth considering the implications.
We saw this exact move in the 1990s dot-com bubble. While it would take investors who bought this “channel jump” nearly a decade to break even, the short term returns were massive. The Nasdaq doubled in a 12-month period before coming crashing down. Might we be on the cusp of another speculative bubble in technology? It’s certainly possible and our current economic environment may even be fostering such a bubble. This is certainly a situation that has our attention.
The Federal Reserve made it entirely clear at their July meeting that they are not even thinking about thinking about raising rates from zero over the next 18 months. Our interest rate tracking metric seems to agree as interest rates have a 100% probability of staying at 0% through March of 2021. U.S. Congress is currently working on another multi-trillion dollar stimulus package for COVID-19 relief.
Global Equity: The Falling Dollar Boosts Emerging Markets
Emerging markets (EM) rode the tailwind of the falling U.S. dollar in July. This dollar weakness provided the bump it needed to stay above the major support/resistance around $42. A breakout above the downward moving trend line around $45, could go a long way for the sector. Technology has been a huge tailwind as of late for EMs as well as many Asian emerging market countries produce technology components. With technology continuing to be the strongest sector around the world, EMs could be a great play going forward. There is some work still to be done, but there is big potential in this sector.
Real Estate: Uncertainty Remains
Real Estate hardly budged this past month as investors have become mostly disinterested in the sector as a whole. From a chart perspective there isn’t much to be excited about. Though an important support level (top horizontal line) was held this past month the sector is still lagging most risk assets on the year. Moreover, the COVID-19 policy response from lawmakers largely left real estate out in the cold. There are very few relief or bailout conversations being discussed for real estate owners, while forbearance and missed rent payments have been allowed by the U.S. government. If property owners are stuck with the bill in the end, this sector’s recovery will take even longer.
Commodities: New All Time Highs for Gold, Silver Breaks Out
Gold made a new all-time high for the first time in about a decade as its impressive run continued through July. Following the break out in June, gold wasted little time plowing through our $1800 and $1900 price targets en route to fresh high values. Though the tailwinds for gold are many, this type of price action is unsustainable, and a pull back to the $1900 level could be the breather that gold would need to continue this broader move higher. If gold bull markets of the past are any indication, this current bull market has lots of room to run.
If you liked what gold did in July, you loved silver’s month. Silver has rallied nearly 40% from the beginning of July — one of the best months in nearly 50 years. Zooming out, you can see the big move brewing. A massive reversal pattern was forming at the breakout level ($19) that had been resistance or support for silver for over a decade. Due to the size of the reversal pattern, once silver broke through, a price target of $26-27 was completely reasonable. This move has been huge, so pullback or timeout from silver at these price levels would be appropriate to keep this rally going.
Our final note on gold and silver shows the gold/silver relationship over the last 15 years. Generally, a pattern exists that favors gold, but when that trend breaks, as we’ve seen in 2010-2011 and now in 2020, these periods lead to massive outperformance of silver when compared to gold. These periods of time tend to lead to good performance from gold and great performance from silver. It’s a relationship we’ll continue to monitor.
Fixed Income: Interest Rates Are Not Looking Healthy
Interest rates continue to fall for fixed income investments. The bellwether 10-year U.S. treasury (UST) yield is now fast approaching it’s all-time low of 0.5% set last March. Even with current muted inflation, the real yield of a 10-year UST after accounting for inflation is -1%. If inflation picks up, as many experts are predicting, bonds become even more unattractive. It’s no wonder investors are piling into stocks and gold.
All Terrain Portfolio Update
The All Terrain Portfolio will add another small allocation of risk to its currently limited risk levels. However, we will look to add additional risk assets small in size and narrow in focus. We will continue to follow our methodology and indicators to find buying opportunities and manage risk.
Past performance is not indicative of future results. Other asset classes or investment vehicles may be used in client portfolios and client portfolios may not hold all positions of the model at the same time as the model. This chart and its representations are only for use in correlation to the proprietary timing model by Arkenstone Financial, Registered Investment Advisor. Actual client and All Terrain Portfolio(TM) positions may differ from this representation.
- U.S. Stocks Make New Highs - December 6, 2024
- Rising Rates Create Headwinds - November 8, 2024
- The Fed Finally Cuts Rates - October 10, 2024


Leave a Reply