In a Nutshell: U.S. stocks continue to outperform global stocks. Gold remains strong as bonds appear primed for their next move.
Domestic Equity: A Tale of Two Markets
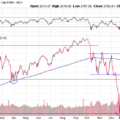
The S&P 500 just completed the biggest 50-day rally of all time and is now trading furthest away from its 50-day moving average ever. Of course, context is important since this came on the heels of the fastest 35% fall ever. The S&P 500 also broke through the important 3000 level we mentioned last month. Needless to say, price action in the short term has been very positive.
However, the Covid-19 pandemic has turned the U.S. stock market into a tale of the haves and have nots. Technology and healthcare – sectors whose cashflows were largely unaffected or even improved by the lockdown – are approaching or making new highs. We can see that playing out in a software intensive holding below.
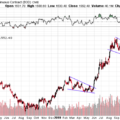
Most of the other market sectors continue to struggle. Cyclical sectors like industrial production (below), financials and materials still remain nearly 25% below their pre-pandemic high water marks. Even the defensive sectors like consumer staples and utilities are struggling to recover. Rotation from the very few leading sectors into the lagging sectors could go a long way in pushing broad markets higher. The move up is much harder from here if we don’t have full sector participation.
The Federal Reserve had a pretty quiet month by their recent standards. That didn’t stop them from making another historic move, as for the first time ever, the Federal Reserve has started purchasing corporate debt of American companies through investment funds called Exchange Traded Funds (ETFs). Bond markets continue to price a high probability of short term interest rates staying pegged at 0% through early 2021.
Global Equity: Making Progress
Emerging markets (EM) pushed through their first big test in May with a very strong month. The small horizontal line below was the first significant level of resistance for EM which is now back in the wide, no-man’s-land range that it has spent much of the last two years. EM has a lot of work to do still, but holding support at the 37-level would be a good start in the rebound.
Real Estate: Back to Resistance
Real Estate had a big month rallying over 15% in May. A big move, especially for a sector so beaten up. However, the real test has just begun as many real estate investments are now back up to price levels that presented short term tops (resistance – top blue line) for much of the last five years. In short, since mid-2016, if the price was below 80, the market moved sideways or down. Above 80, and real estate markets moved up in price. Needless to say, a sustained move over 80 could go a long way for this beaten down sector.
Commodities: Gold Consolidating Again
Gold continues to be one of the best performing assets over the last two years, and last month was no exception. Within any long term trend, there are series of pauses or consolidations in price that move sideways or even counter to the long-term trend. We saw two very distinct consolidations in 2019 that eventually led to a continuation of the broader trend. We appear to be in another consolidation in gold as price has effectively moved sideways for the better part of two months. If the previous consolidations are any indication, this current one may need more time before resolving. In the meantime, investors will be looking for gold to hold the 1675 range in the hopes of eventually moving higher this summer.
Fixed Income: Rates Look Primed for Next Move
Interest rates in the U.S. have finally stabilized after incredible volatility just a few months ago. The chart of the 10-year U.S. treasury yield below shows this stabilization manifesting in the triangle shaped pattern below. This pennant shaped coiling pattern would typically suggest a continuation of the broader trend, which in this case is down. However, if interest rates are going to make a move that supports the growth story that stocks are telling, the next move should be up. Either way, this pattern indicates a big move is coming, up or down. This will be a very interesting chart to follow, since inflation is currently falling rapidly, pushing real rates up. The Federal Reserve would like the least amount of barriers possible to restart the economy, with real rates being one of those barriers. Rising real rates would be a difficult problem for the Fed to fix as they only control nominal rates.
All Terrain Portfolio Update
The All Terrain Portfolio still remains very risk averse at the moment. However, we continue to add risk assets in small size and narrow in focus. We will continue to follow our methodology and indicators to find buying opportunities.
Past performance is not indicative of future results. Other asset classes or investment vehicles may be used in client portfolios and client portfolios may not hold all positions of the model at the same time as the model. This chart and its representations are only for use in correlation to the proprietary timing model by Arkenstone Financial, Registered Investment Advisor. Actual client and All Terrain Portfolio(TM) positions may differ from this representation.
- U.S. Stocks Make New Highs - December 6, 2024
- Rising Rates Create Headwinds - November 8, 2024
- The Fed Finally Cuts Rates - October 10, 2024


Leave a Reply