In a Nutshell: Stocks across the globe rally in response to the fastest sell-off of all time. Bond yields remain historically low while gold continues its impressive run.
Domestic Equity: Stocks, Lead by Tech, Rally
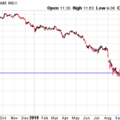
The U.S. stock market posted an impressive 25% rally in April. Broader indices like the S&P 500 still have big price hurdles ahead of them, namely crossing the 3000 level and the 200-day moving average as highlighted below. The fundamental challenges may be even larger for the S&P 500, as Factset is reporting that after the negative earnings growth of the first quarter in 2020, earnings have now declined year over year in four of the last five quarters. Not only does this question the health of the economy pre-coronavirus, but with an extremely negative second quarter of 2020 anticipated, it leads us to question how long stocks can hold on to their sky-high valuations. Forward-looking fundamental valuations of the S&P 500 are currently as high as they were in the early 2000s. Will gravity catch up to price, or can stocks hold on to their lofty valuations long enough to be justified by a rebirth in economic growth?
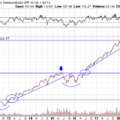
The bright spot in U.S. stocks has been technology which, amazingly, is positive on the year. Below, the tech-heavy Nasdaq index shows this impressive recovery. If the Nasdaq can break through the resistance line as shown below, might all-time highs be on the table? It would be an impressive feat, to say the least, given the economic headwinds we are currently facing.
The Federal Reserve continues its unprecedented monetary stimulus projects to keep the U.S. economy afloat. The rate of new money creation by the Fed has dwarfed previous Fed intervention as they appear to be testing their limits. Interest rates are pegged at zero and the bond market anticipates they will remain there until 2021. However, for the first time ever, bond markets are now pricing in the possibility of negative interest rates in the U.S. by the end of 2020.
Global Equity: Emerging Markets Show Weak Recovery
Emerging markets rallied in April, but could only muster a 13% bounce after a 33% decline in March. Many of the emerging market countries in Asia and South America are commodity and export specialists. These exports are consumed by Americans and Europeans, but with consumption down across the board, that puts a lot of pressure on these export-heavy emerging market countries. Though some of the Asian emerging market countries are a few steps ahead of the U.S. and Europe as far as reopening their economies, their recovery may have to wait until developed markets are ready to consume more freely.
Real Estate: Searching for Stability
Real estate is still struggling to find its footing. With so much unknown regarding future mortgage or lease payments from real estate inhabitants, whether individuals or businesses, it makes sense that this asset class may be on a slow path to recovery. Though real estate yield is still attractive relative to other options, the risk in chasing this yield is the uncertainty of future dividend payments, and loss of value to the underlying assets if occupants are not able to make their monthly payments. It would not be surprising to see a very slow recovery in the real estate sector.
Commodities: Gold Still Shining
Gold is back on track after making a new 52-week high in April. Regardless of the health of stock or currency markets, over the last 18 months gold has displayed one of the most unshakable uptrends of any investment market. It’s been a long journey, but nearly nine years since the last all-time high, gold is just 12% away from matching that previous all time high. Gold should continue to thrive in our current environment of uncertainty and persistent global currency devaluation by central banks across the globe.
Fixed Income: Yield Curves Struggle to Normalize
Yield curve structure can not only provide advance warning of a recession, but also help us understand where we are in recovery. The chart below is the yield spread (difference) between a 10-year U.S. treasury bond and a three-month U.S. treasury bond. In past recoveries, after inversion, economic health was not restored in stocks until the spread was in the 3.5% range. Seeing that we are currently at 0.6%, this suggests we have a ways to go. The Federal Reserve has its work cut out in returning the yield curve to normal. As we’ve highlighted before, yields are historically low across the entire yield curve. As bond markets have now sniffed out the possibility of negative short-term rates in the U.S., might this be the unprecedented path to restoring normalcy?
All Terrain Portfolio Update
The All Terrain Portfolio remains very risk averse at the moment. However, we have added risk assets in small size and very specific technology-oriented sectors. We will continue to follow our methodology and indicators to find buying opportunities, though at the moment few exist.
Past performance is not indicative of future results. Other asset classes or investment vehicles may be used in client portfolios and client portfolios may not hold all positions of the model at the same time as the model. This chart and its representations are only for use in correlation to the proprietary timing model by Arkenstone Financial, Registered Investment Advisor. Actual client and All Terrain Portfolio(TM) positions may differ from this representation.
- U.S. Stocks Make New Highs - December 6, 2024
- Rising Rates Create Headwinds - November 8, 2024
- The Fed Finally Cuts Rates - October 10, 2024


Leave a Reply