In a Nutshell: Stocks fell in August on the heels of the first interest rate cut from the Federal Reserve in more than a decade. Bond yields continued to fall and safe haven investments like gold and bonds continue to outperform.
Domestic Equity: Stocks Drop, Volatility Elevated
The “rate cuts are good for stocks” narrative was dismissed quickly as stocks dropped nearly 10% to start August. This drop came just days after the Federal Reserve cut rates by 0.25%. Although stocks found some footing by the end of the month, the chart below highlights our new normal of low returns and high volatility for stocks. The chart’s two diagonal lines depict what is potentially a relatively rare topping formation highlighted by a series of higher highs and lower lows. Although market tops are extremely difficult to call, given the recent stagnation in U.S. stocks, this topping pattern is worth monitoring
Even though the Federal Reserve called their most recent rate cut a “mid-cycle adjustment,” the bond markets are behaving as if we are in an end cycle rate cutting environment. Current bond pricing is projecting a 94% chance of another cut in September with at least one more cut by the end of 2019. Although there are some exceptions, Federal Reserve rate cuts typically occur at or prior to recessions. Thus, we are monitoring Federal Reserve policy actions closely.
Global Equity: Emerging Markets Break Down
Last month we discussed the possibility of some long-needed resolution in emerging markets. It appears we got our resolution to the downside. A breakdown through the uptrend line shown below could lead to more downside in emerging markets. Along with a strong dollar, emerging markets face big headwinds.
Real Estate: Steady Growth
After a bit of a lull in July, real estate picked back up and stayed in its uptrend in August. With stocks stuck in a range and picking up in volatility, and bond yields plummeting, real estate has been the go-to for investors. With its low correlation to stocks and higher yields than bonds, this is the perfect place for investors to lay low.
Commodities: The Dollar Grinds Higher
Aside from precious metals, commodities continued to get beat up with August as no exception. Copper is one of those commodities that have performed poorly as of late – which is of particular interest on a global scale as copper is one of the highest-demanded metals in a growing economy as it is a key component in building and vehicle construction. The copper chart below gives us a glimpse into why global growth concerns are beginning to surface. Copper recently formed a massive topping pattern and has since broken through it. If this break down holds, copper could find its way to the 2016 lows, which would likely coincide with increased global growth concerns.
Perhaps the most important chart right now is the U.S. dollar chart because of its significant impacts on commodities prices and stocks. If the dollar stays above the blue support line below, it will continue to put pressure on the global economy.
Fixed Income: No Relief to Be Found in Bond Yields
Bond yields continued to fall at a rapid pace in August. In fact, for the first time ever, the 30-year U.S. Treasury bond yield has fallen below 2%. Generally speaking, these types of quick drops in yields are associated with higher than normal perceived risks in the stock market. When investors see risk, they are willing to accept the safety of U.S. Treasuries at a reduced rate of return (yield), and when more and more investors pile into Treasuries, they are issued at lower and lower rates.
As you can see below, as rates fall, bond prices increase as higher-yielding bonds of the same maturity become more valuable.
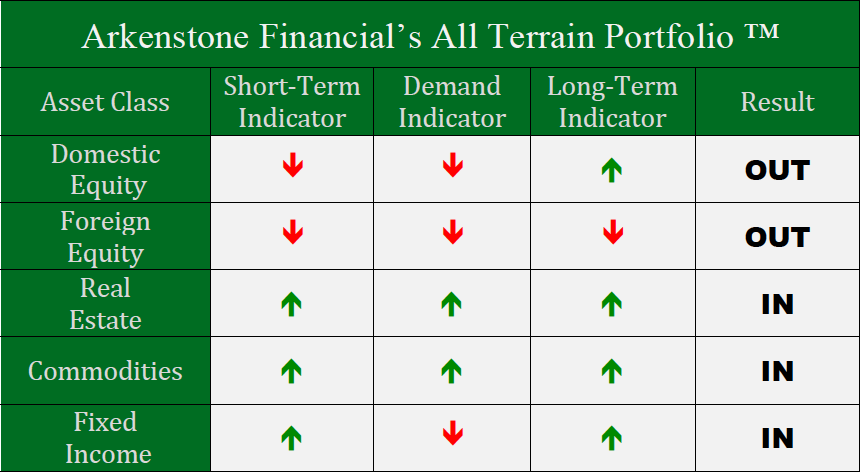
All Terrain Portfolio Update
We’ve taken a more defensive stance while staying within our model parameters in the All Terrain Portfolio as uncertainty and volatility increase following the recent policy shift by the Federal Reserve. We will continue to monitor our indicators for more clarity.

Past performance is not indicative of future results. Other asset classes or investment vehicles may be used in client portfolios and client portfolios may not hold all positions of the model at the same time as the model. This chart and its representations are only for use in correlation to the proprietary timing model by Arkenstone Financial, Registered Investment Advisor. Actual client and All Terrain Portfolio(TM) positions may differ from this representation.
- U.S. Stocks Make New Highs - December 6, 2024
- Rising Rates Create Headwinds - November 8, 2024
- The Fed Finally Cuts Rates - October 10, 2024


Leave a Reply