In a Nutshell: In May, the ten-year U.S. treasury yield plummeted while U.S. and global equities experienced losses.
Domestic Equity: Stocks Finally Take a Breather
U.S stocks finally cooled off after their hot start to the year. Broad indices pulled back 6-7% over the month after briefly making new all time highs. The inability of markets to make and sustain new high values over the January 2018 highs indicates how trendless this market has been over the last year and a half. As you can see below, the S&P 500 is essentially at the same price level it was to start 2018. With important market indices like financials and small cap stocks unable to sustain their recent breakouts, patience will be required with this current market. Until we resume an uptrend, the risk outweighs the reward.
We previously mentioned that when the Federal Reserve stops raising rates, or pauses, a rate cut is not far behind. The Federal Reserve is right on schedule after pausing rates in January, with Fed members recently suggesting that they would be willing to cut interest rates in the near future as a preventative measure. The bond markets couldn’t agree more as they are now pricing in a 70% chance of a rate cut by July of 2019, and a 98% chance of a cut by the year’s end.
Some brief context for rate cuts: Over the last four decades, we have seen that rate cuts can help sustain economic growth for years. However, rates cuts that coincide with an inverted yield curve — which is currently the case — tend to be much less effective and typically signal the end of an economic cycle.
Global Equity: Emerging Markets Still Murky
Emerging markets, particularly China, struggled in May. Like so many markets across the globe, they find themselves caught between two trends. Below you can see the longer-term up trend has held dating back to 2016, but the shorter-term down has yet to be resolved. With these two trends converging, we’ll have resolution eventually, but the direction of that resolution remains to be seen.
Real Estate: Continued Relative Strength
Real estate continues to hold up well despite the recent poor performance in stocks and bond yields. Although momentum has cooled in the real estate market, prices have held up. Further support for this sector could be found by investors looking for yield as bond yields continue to fall.
Commodities: Gold Hoping Dollar Reverses
Last month we mentioned that the dollar chart was facing some technical challenges that indicated it was losing steam. The updated chart below shows our thesis has held true so far. Resistance (the horizontal line) was not breached and the trendline (diagonal) now appears to be in danger of being broken.
All of this dollar action is taking place while gold is lining up to break out of six year consolidation. It’s no coincidence as the dollar and gold generally trade inversely. If the dollar falls, expect gold to break out. If the dollar holds, gold will have to wait its turn.
Fixed Income: Intermediate Term Treasury Yields Collapse
While stocks grabbed all the headlines with their recent pullback, the real story in May was the fall in the 10 year U.S. Treasury Yield. In May, the 10 year yield fell 0.5% nominally, or 16% on a relative basis. The fall in the 10 year yield pulled the yield curve soundly into inverted territory, with the 1, 2, 3, 5, 7, and 10 year treasuries all now yielding less than the 3 month treasury bill. Now the big question is whether or not the much anticipated rate cut on short-term rates by the Federal Reserve can restore normalcy to the yield curve, and by extension, the long-term outlook for equity markets.
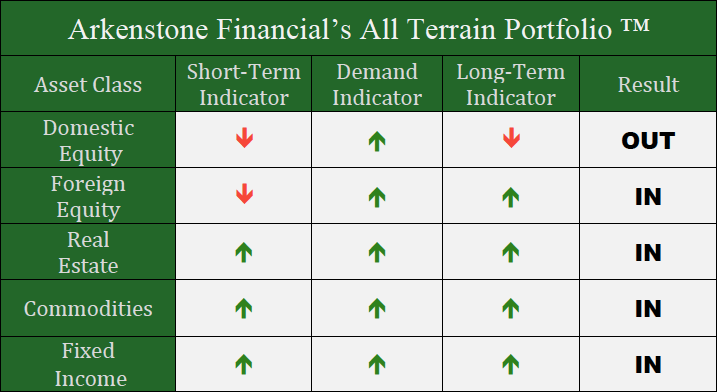
All Terrain Portfolio Update
Our model dictated that we reduce our risk exposure and we’ve done just that. We’ll continue to monitor our various indicators for future growth opportunities. In the meantime, we’ll err on the side of caution and keep managing risk as our primary objective.

Past performance is not indicative of future results. Other asset classes or investment vehicles may be used in client portfolios and client portfolios may not hold all positions of the model at the same time as the model. This chart and its representations are only for use in correlation to the proprietary timing model by Arkenstone Financial, Registered Investment Advisor. Actual client and All Terrain Portfolio(TM) positions may differ from this representation.
- U.S. Stocks Make New Highs - December 6, 2024
- Rising Rates Create Headwinds - November 8, 2024
- The Fed Finally Cuts Rates - October 10, 2024


Leave a Reply