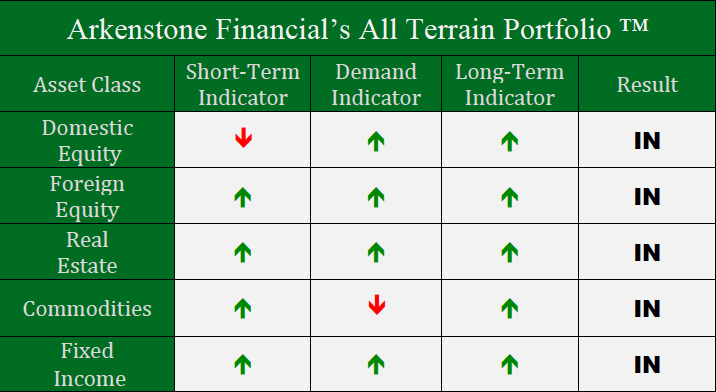
In a Nutshell: In March we saw bond yields plummet, which added fuel to the bond and real estate rally. U.S. equities continue to pass all strength tests, with global equities following suit.
Domestic Equity: Another Round of Growth Around the Corner?
U.S. stocks continue to plow through any potential resistance on their way up. We mentioned previously that the 2800 level would be important. Not only did the S&P500 break through this level, it came back and briefly tested the level on its way to the January 2018 high — great sign of strength.
This short term strength in U.S. equities has us considering the medium to longer-term implications. A good indicator of future growth is the Semiconductor sector. Below, we examine a recurring growth pattern that dates back to 2012. We appear to be on the very edge of another expansion possibility based on the chart below. Each arrow in the chart indicates the point where a new high value could not be held, which is then followed by a correction and recovery. The circled area indicates where that previous high value is broken and held. As you can see, an enormous rally immediately ensues. If our most recent breakout in semiconductors holds, stocks across the globe look primed for a run.
The Federal Reserve meeting this past March was the catalyst for a large drop in bond yields. At this meeting, the Federal Reserve said they saw no rate hikes in 2019. This statement comes just three months removed from another statement of intent to raise rates 3-4 times in 2019. The bond markets now have priced in a better than 50% chance of a rate cut 2019.
Global Equity: Emerging Markets Continue to Set the Pace
Global equities continue to rally along with U.S. stocks. Emerging markets continue to lead foreign stocks and March was no exception. From a charting perspective, emerging markets have one of the best looking charts out there. The basing process at the end of 2018 led to a breakout in early 2019. A brief test of the support level that also happens to be a previous high value (2014) is further confirmation that the current uptrend has strength.
Real Estate: More All Time Highs
We have been bullish on real estate for some time now, and our case continues to get stronger. The dip in bond yields added more strength to this trade, while yield-thirsty investors continue to chase assets with yields that exceed bond yields. With real estate paying out nearly double what a treasury bond would, expect prices to rise. While the current run in this asset class may not keep its current pace, the trend should stay up.
Commodities: Finally Breaking Through?
The commodities sector as a whole has been a bit of a mess for years. As you can see below, commodities have broken through their current downtrend, while staying above what we consider to be a healthy support level (the blue horizontal line). With many precious metals looking poised to run while oil has been rallying, could this be the beginning of a longer term rally for commodities? That remains to be seen, but what we’ve seen in 2019 so far is a good start.
Fixed Income: Yields Tumble, Treasuries Breakout
We previously suggested that bond yields would continue their downward trajectory. The benchmark 10-year treasury yield fell nearly 10% in the month of March as bond markets began to price in the increasing probability of the Federal Reserve cutting interest rates in 2019.
Yields and bond values move inversely, meaning when market yields fall, bond values increase. Long term treasuries illustrate this move perfectly, as the drop in yields triggered a fresh breakout above a two year price resistance level. Assuming long term treasuries can hold this breakout level, a run at the 2016 highs is not out of the question.
All Terrain Portfolio Update
We continue to monitor our current investment environment closely as the longer-term market trends continue to shake out. We have added more risk assets to the All Terrain Portfolio this month, but in small and strategic positions with the hope of adding more if trends continue to stay positive.

Past performance is not indicative of future results. Other asset classes or investment vehicles may be used in client portfolios and client portfolios may not hold all positions of the model at the same time as the model. This chart and its representations are only for use in correlation to the proprietary timing model by Arkenstone Financial, Registered Investment Advisor. Actual client and All Terrain Portfolio(TM) positions may differ from this representation.
- U.S. Stocks Make New Highs - December 6, 2024
- Rising Rates Create Headwinds - November 8, 2024
- The Fed Finally Cuts Rates - October 10, 2024


Leave a Reply